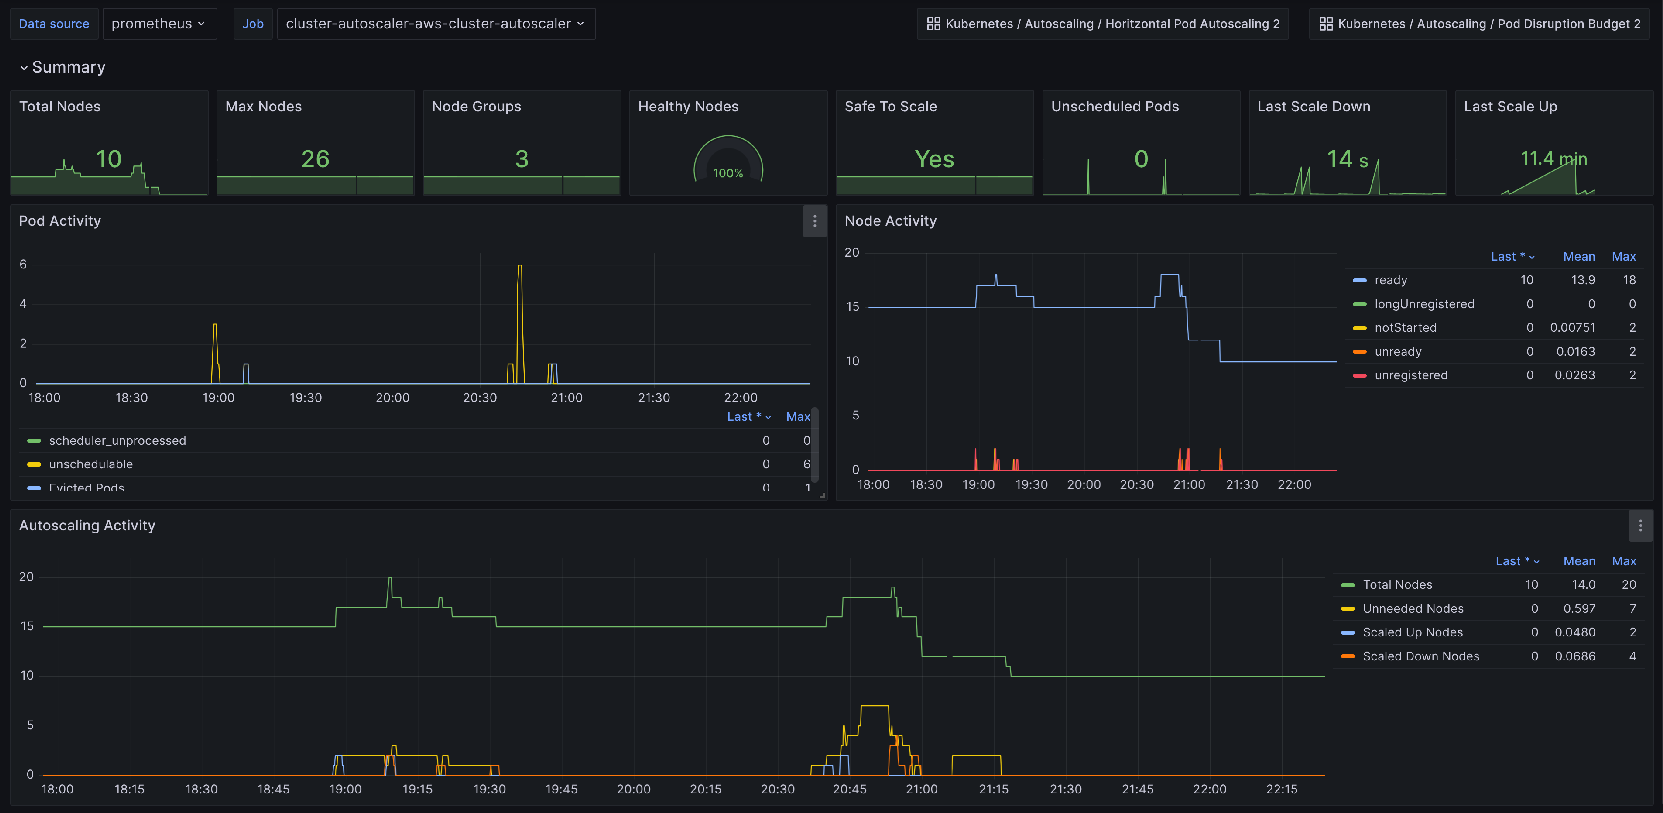
Cluster autoscaler is a popular tool for automatically adjusting the size of a Kubernetes cluster based on the current workload. It helps ensure that your applications have enough resources to run efficiently while minimizing costs by scaling down unused nodes. However, monitoring the cluster autoscaler is crucial to ensure that it is functioning correctly and that your applications are running smoothly.
I've written multiple blog posts on Kubernetes autoscaling monitoring, including Comprehensive Kubernetes Autoscaling Monitoring with Prometheus and Grafana, Karpenter Monitoring with Prometheus and Grafana, Keda Monitoring With Prometheus and Grafana and Configuring VPA to Use Historical Metrics for Recommendations and Expose Them in Kube-state-metrics. This post focuses on monitoring Cluster Autoscaler with Prometheus and Grafana, but is still be apart of the same Github repository as the other posts, so you can find all the code and configuration files in one place.
The repository is the kubernetes-autoscaling-mixin on Github. It contains Grafana dashboards and Prometheus rules for Keda, HPA, VPA, Cluster Autoscaler, PDBs, and Karpenter.
There is already one dashboards that published in Grafana:
- Cluster Autoscaler - An overview of the Cluster Autoscaler,.
There are also Prometheus alerts stored in GitHub that you can import that cover the common Cluster Autoscaler issues.
Enabling Metric Collection for Cluster Autoscaler
To monitor Cluster Autoscaler, you need to enable metric collection. This is typically done by enabling a service monitor for Cluster Autoscaler in your Kubernetes cluster.
Using Helm, you should deploy Cluster Autoscaler with the following values:
serviceMonitor:
  enabled: true
Grafana Dashboards
Cluster Autoscaler
The Grafana dashboard for Cluster Autoscaler provides insights into the scaling operation that occur. Its panels include:
- Node Pool graphs - Displays the current and desired number of nodes in each node pool, along with the number of nodes that are in the process of being added or removed. This helps you understand how the Cluster Autoscaler is adjusting the size of your cluster based on workload demands.
- Scaling Events - Shows a timeline of scaling events, including when nodes were added or removed from the cluster. This helps you track the history of scaling operations and identify any patterns or trends.
- Pod Scheduling - Displays the number of pods that are pending, running, or failed to schedule.

Prometheus Alerts
Alerts are trickier to get right for a generic use case, however they're still provided by the Kubernetes-autoscaling-mixin. They're also configurable with the config.libsonnet package in the repository, if you are familiar with Jsonnet then customizing the alerts should be fairly straight forward. Alerts are available on GitHub, and I'll add a description for the alerts below.
- Alert name:
ClusterAutoscalerNodeCountNearCapacity
Alert triggers when the number of nodes in a node pool is close to its maximum capacity. This indicates that the cluster may not be able to scale up further to accommodate additional workloads.
- Alert name:
ClusterAutoscalerUnschedulablePods
Alert triggers when there are pods in the cluster that are unschedulable for a prolonged period. This indicates that the Cluster Autoscaler may not be able to find suitable nodes to schedule these pods, which could lead to application downtime.

