The External Secrets Operator (ESO) syncs secrets from external providers like AWS Secrets Manager, Vault, or GCP Secret Manager into Kubernetes Secret objects. If a SecretStore loses its credentials, or an ExternalSecret stops syncing, applications can end up running on stale secrets with no obvious signal in application logs. This post covers monitoring ESO with the external-secrets-operator-mixin, which provides two Grafana dashboards and a set of Prometheus alerts. Issues and feedback are welcome on GitHub.
Prerequisites
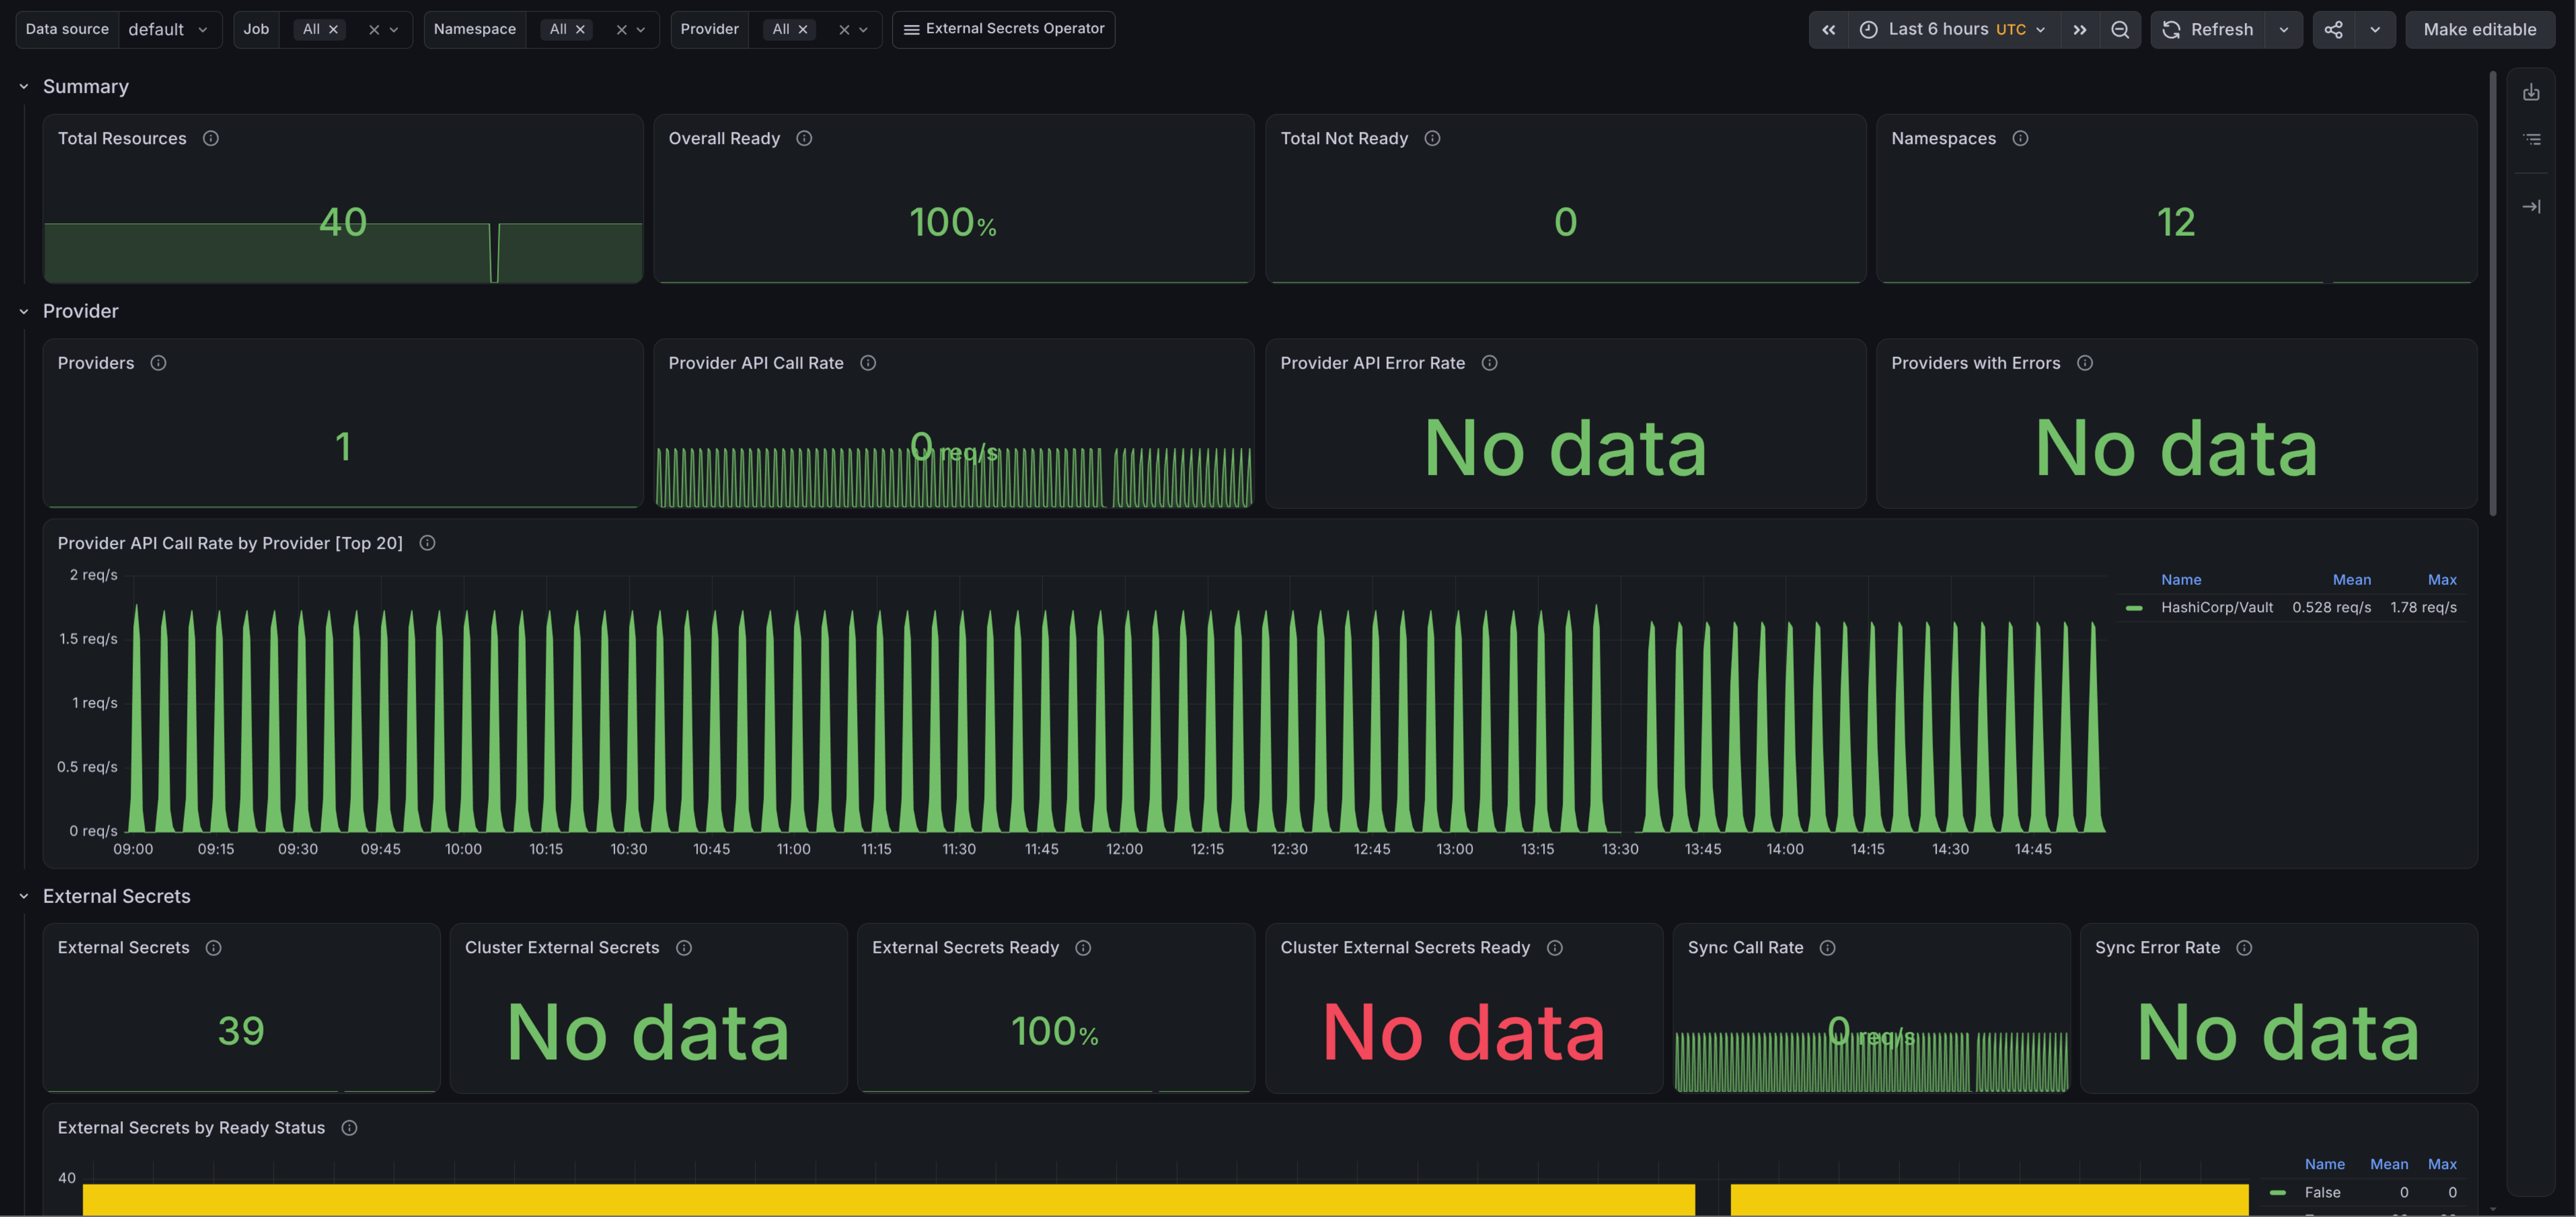
The mixin relies on the metrics ESO itself exposes: externalsecret_*, clusterexternalsecret_*, secretstore_*, clustersecretstore_*, pushsecret_* and clusterpushsecret_* (see the ESO metrics docs). If deploying via Helm, set serviceMonitor.enabled: true.
ESO's namespaced metrics carry their own namespace label, which most Prometheus setups (including kube-prometheus-stack) overwrite on scrape unless honor_labels: true is set - the real value survives as exported_namespace instead. The mixin's config.libsonnet exposes a namespaceLabel setting (default exported_namespace) to match your scrape config.
This mixin only covers ESO's own resource metrics, not the underlying controller-runtime/webhook/workqueue health common to any kubebuilder operator.
Grafana dashboards
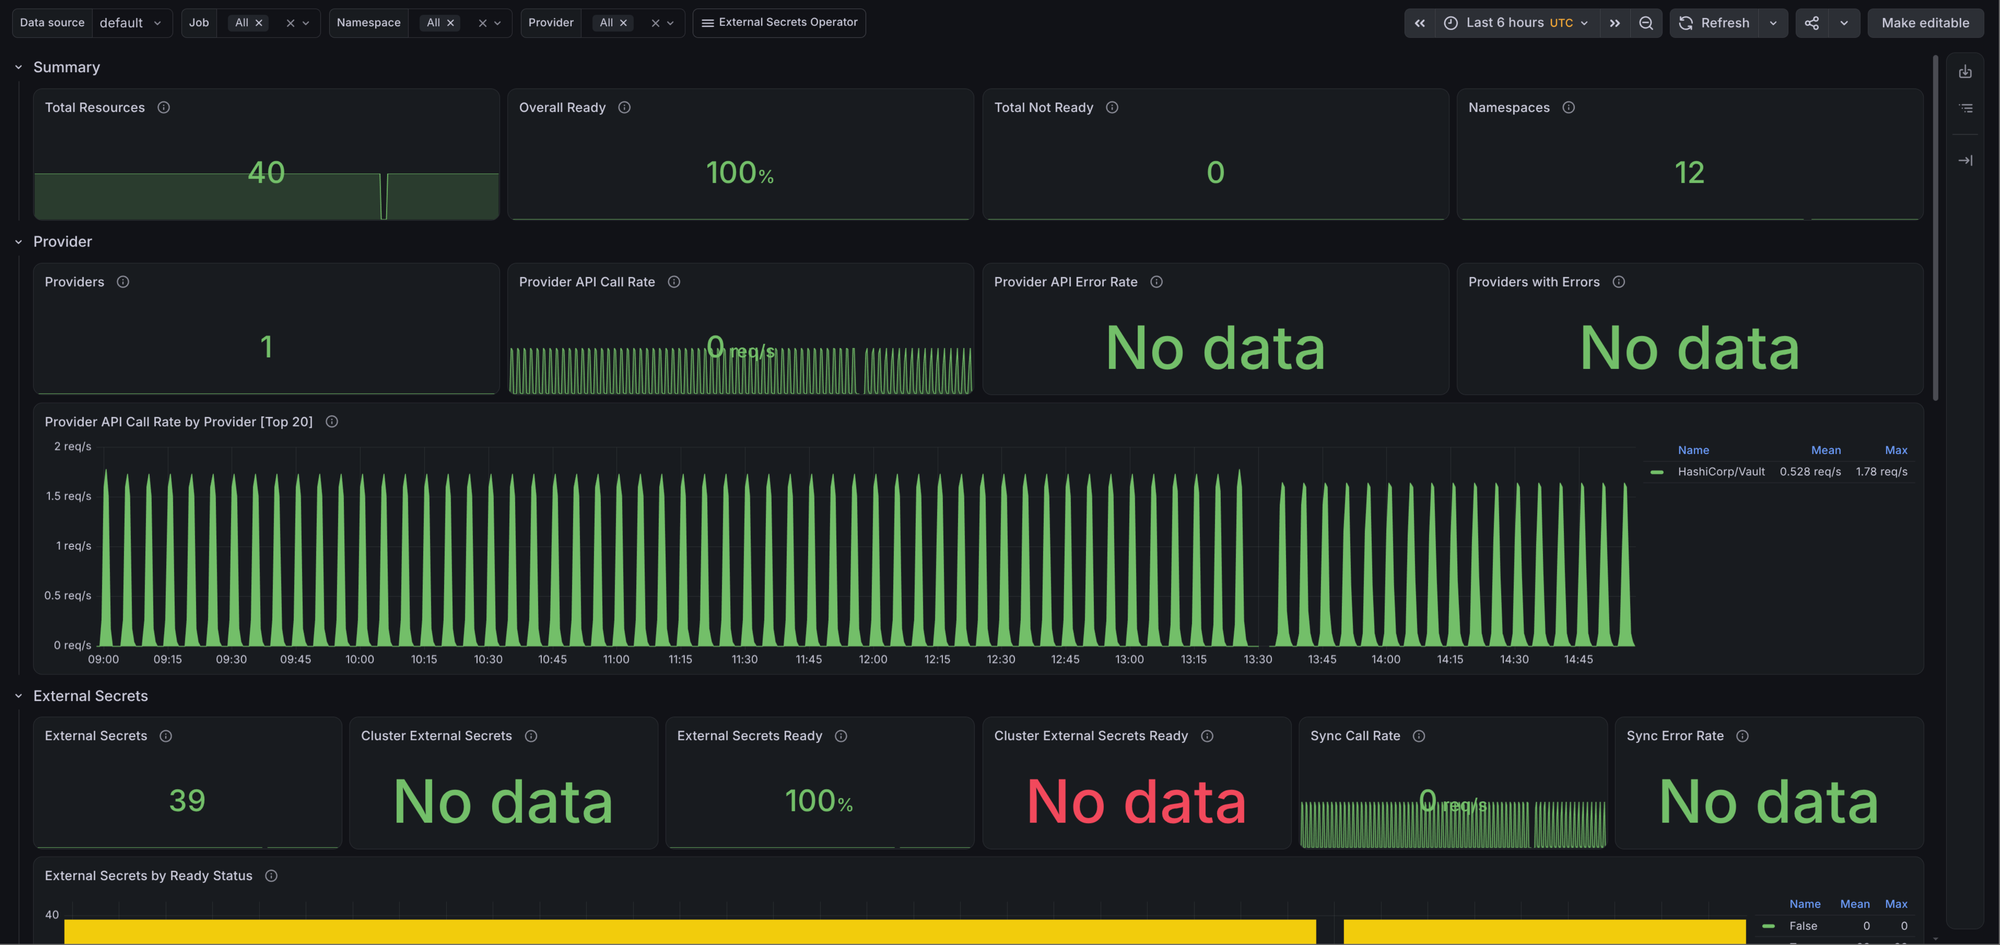
External Secrets Operator / Overview
A fleet-wide health dashboard, filterable only by namespace and provider - no per-resource drill-down. It's organized into one row per concern: a fleet-wide summary, provider API health, and then counts, ready percentage and not-ready tables for each of ExternalSecret, SecretStore and PushSecret (plus their Cluster-scoped variants). Every not-ready table links straight to the Resources dashboard, pre-filtered to that resource.
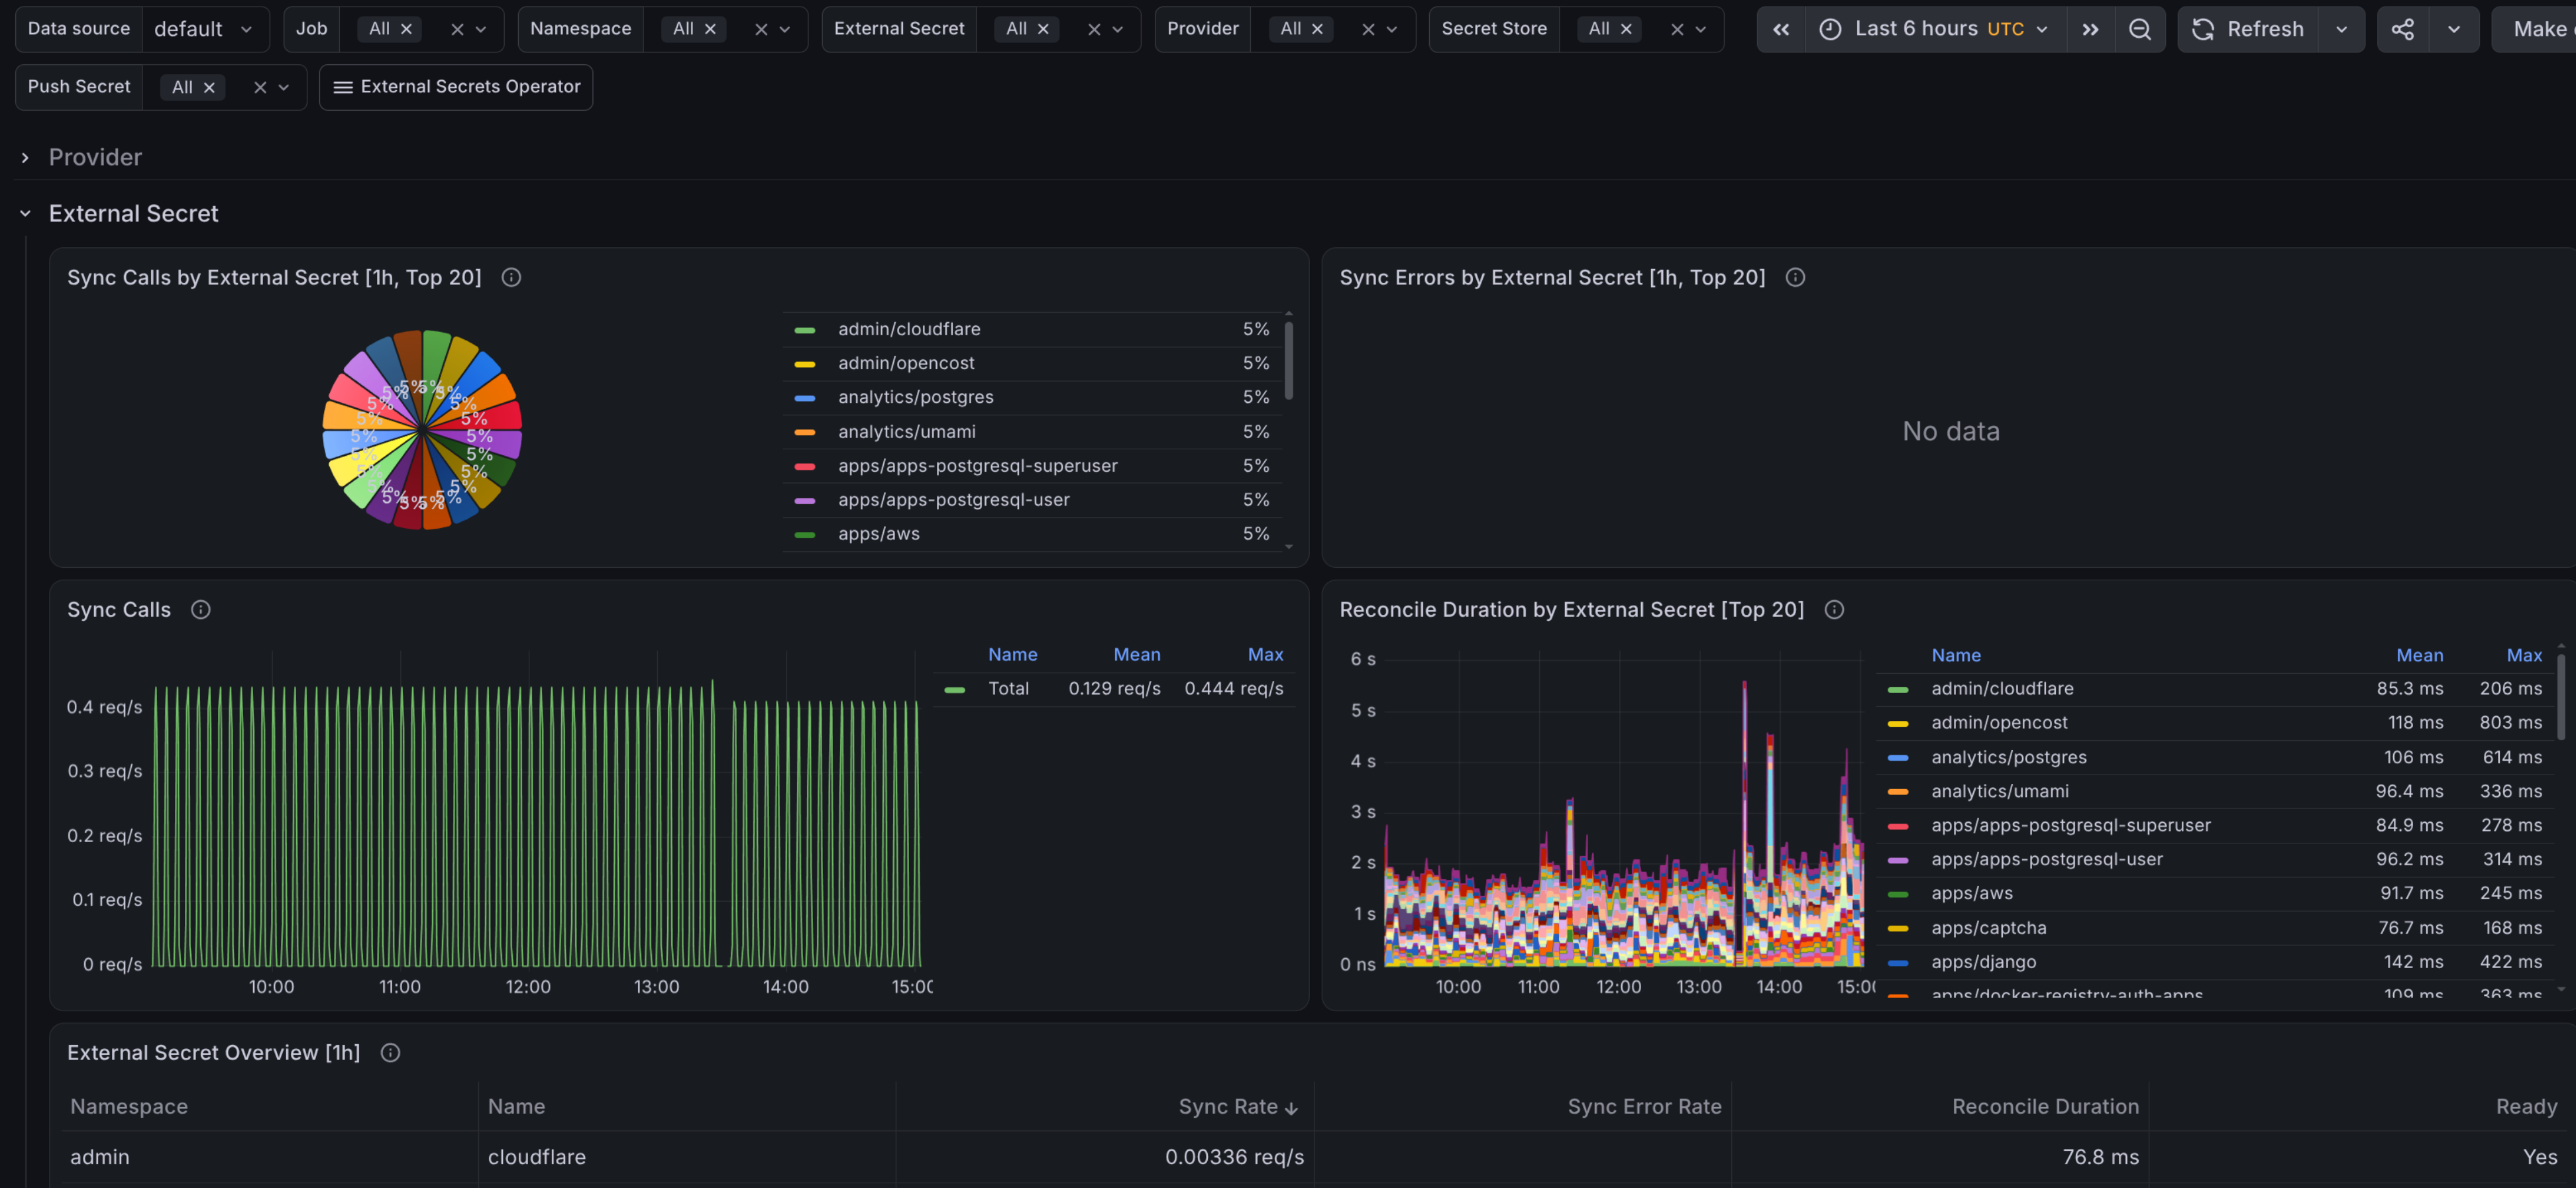
External Secrets Operator / Resources
Drills into a specific resource kind: sync call rates and errors, reconcile duration, readiness and provider API health, broken down per resource name. Only the Provider and External Secret rows are expanded by default; the less-frequently-needed kinds (ClusterExternalSecret, SecretStore, ClusterSecretStore, PushSecret, ClusterPushSecret) get their own rows collapsed by default. Panels that break down by resource name are capped with topk() (noted in the panel title) so a namespace with hundreds of ExternalSecrets doesn't turn a panel into noise.
Alerts
You can configure alerts using the config.libsonnet file in the repository - each can be individually enabled or disabled, with adjustable severities and for durations. The alerts can be found on GitHub, and I'll add a description for the alerts below.
| Alert | Description |
|---|---|
ExternalSecretsSyncErrors |
Alerts when more than 5% of an ExternalSecret's sync calls fail over 15 minutes. Usually a provider rejection or a changed secret path. |
ExternalSecretsExternalSecretNotReady |
Alerts when an ExternalSecret reports Ready=False for 15 minutes. |
ExternalSecretsClusterExternalSecretNotReady |
Alerts when a ClusterExternalSecret reports Ready=False for 15 minutes. |
ExternalSecretsSecretStoreNotReady |
Alerts when a SecretStore reports Ready=False for 15 minutes. Typically invalid credentials or an unreachable provider, which blocks every ExternalSecret that references it. |
ExternalSecretsClusterSecretStoreNotReady |
Alerts when a ClusterSecretStore reports Ready=False for 15 minutes. |
ExternalSecretsPushSecretNotReady |
Alerts when a PushSecret reports Ready=False for 15 minutes. |
ExternalSecretsClusterPushSecretNotReady |
Alerts when a ClusterPushSecret reports Ready=False for 15 minutes. |
ExternalSecretsProviderApiHighErrorRate |
Alerts when more than 5% of API calls to a provider backend fail over 15 minutes. Grouped by provider rather than resource, so it's the first signal of a provider-wide outage or credential rotation. |
Each alert's dashboard_url annotation links straight to the Resources dashboard, pre-filtered to the affected resource.