
Karpenter now exposes enough pricing data to estimate Kubernetes node costs directly from Prometheus metrics. The existing Karpenter dashboards in the kubernetes-autoscaling-mixin already cover node pools, instance types, and scaling behavior. This post focuses on the new cost dashboard: estimated monthly cost, spot instance savings, and node pool cost breakdown in Grafana.
This builds on the earlier posts on Karpenter monitoring with Prometheus and Grafana, comprehensive Kubernetes autoscaling monitoring, and Kubernetes cost tracking with OpenCost. If you want actual cost allocation, shared resource accounting, and historical cost analysis, use OpenCost and the opencost-mixin. This Karpenter dashboard answers a narrower question: what does the current Karpenter-managed node fleet look like in dollars?
The dashboard is available in the kubernetes-autoscaling-mixin repository as kubernetes-autoscaling-mixin-karpenter-costs.json. It adds one new Karpenter dashboard:
- Karpenter Costs: estimated monthly node cost, cost split by node pool / capacity type / architecture / instance type, and estimated spot savings.
Karpenter cost metrics used by the dashboard
The dashboard combines two kinds of Karpenter metrics:
karpenter_nodes_allocatable, which tells us which nodes are currently active and what labels they carry such asinstance_type,capacity_type,zone,arch, andnodepoolkarpenter_cloudprovider_instance_type_offering_price_estimate, which exposes Karpenter's current price estimate for a given instance type, capacity type, and zone
From there, the core calculation is straightforward: count active nodes per instance type and multiply that by the matching price estimate.
sum(
  max by (instance_type, capacity_type, zone) (
    karpenter_cloudprovider_instance_type_offering_price_estimate
  )
  * on (instance_type, capacity_type, zone)
  count by (region, zone, instance_type, capacity_type) (
    max by (node_name, region, zone, instance_type, capacity_type) (
      karpenter_nodes_allocatable{resource_type="cpu"}
    )
  )
)
That gives you something useful very quickly. It is also important to be precise about what it is not:
- It is not cloud billing data.
- It does not include control plane charges, load balancers, disks, or network egress.
- It does not allocate shared cluster costs to namespaces or workloads.
- It reflects the current fleet shape and current price estimates, not a full historical bill.
That limitation is why the dashboard description points directly to OpenCost for deeper analysis.
How to enable the Karpenter cost dashboard
If you already use the kubernetes-autoscaling-mixin for Karpenter monitoring, update the mixin and import the dashboard JSON like the other Karpenter dashboards.
If you only want the Karpenter dashboards enabled, a minimal config.libsonnet still looks like this:
{
  _config+:: {
    karpenter+: {
      enabled: true,
    },
    clusterAutoscaler+: {
      enabled: false,
    },
    vpa+: {
      enabled: false,
    },
    keda+: {
      enabled: false,
    },
  },
}
What the dashboard shows
The dashboard has two sections.
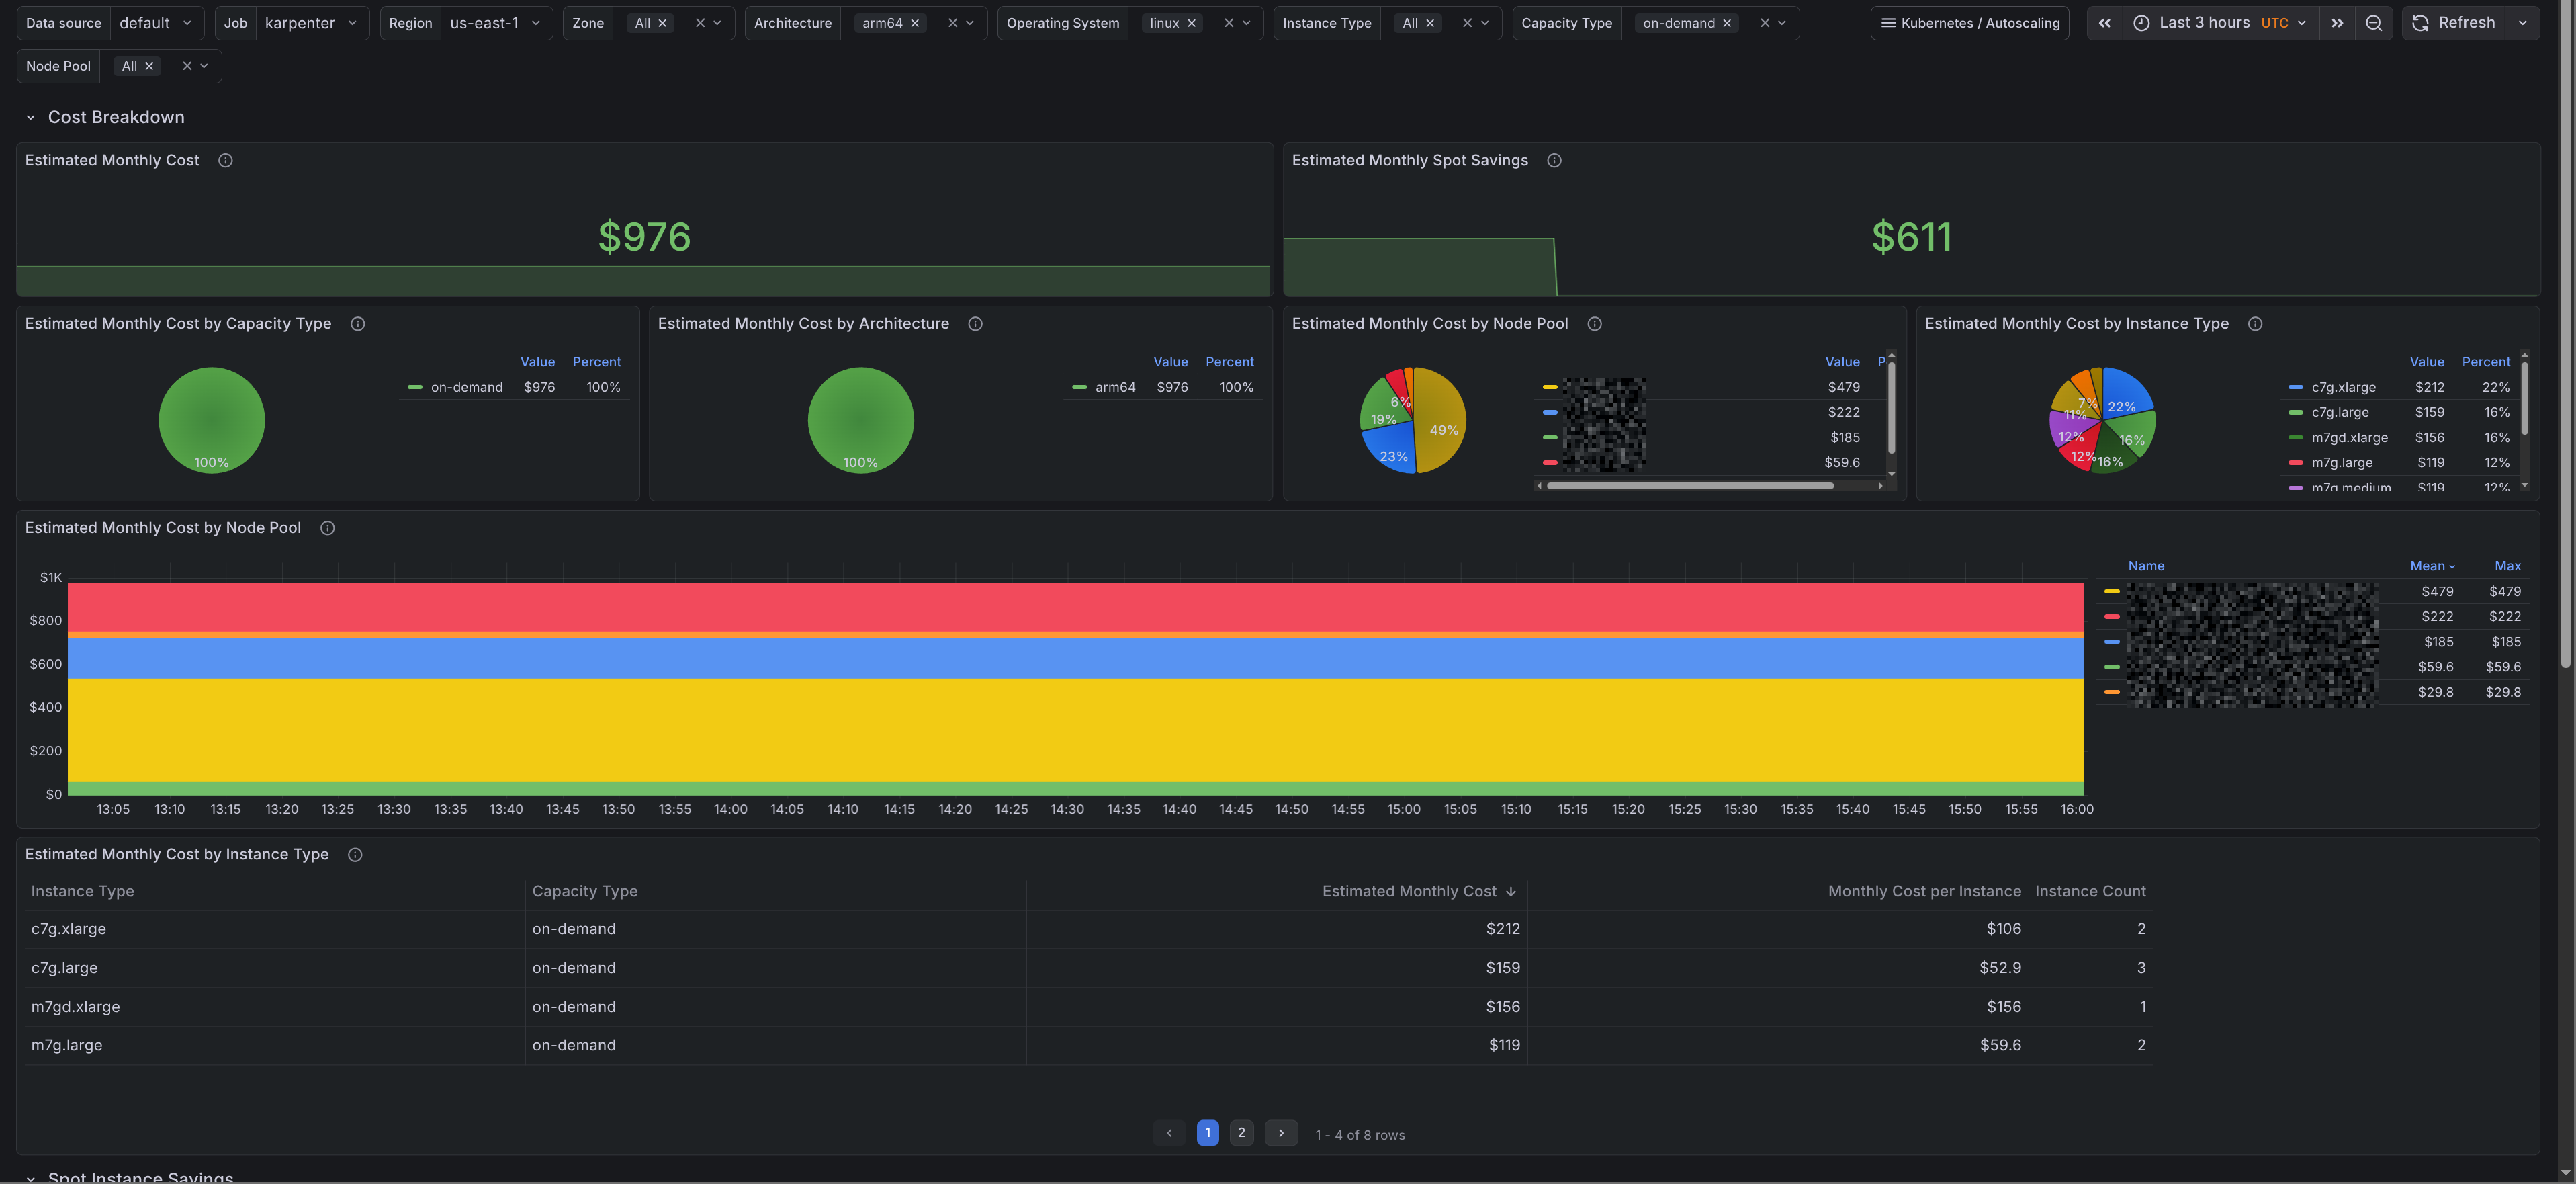
Cost breakdown
The first section shows the current monthly run rate and breaks it down by:
- capacity type
- architecture
- node pool
- instance type
There is also a node pool time series and a table with monthly cost, monthly cost per instance, and current instance count by instance type. That makes it easy to see whether a node pool is expensive because of replica count, instance choice, or both.
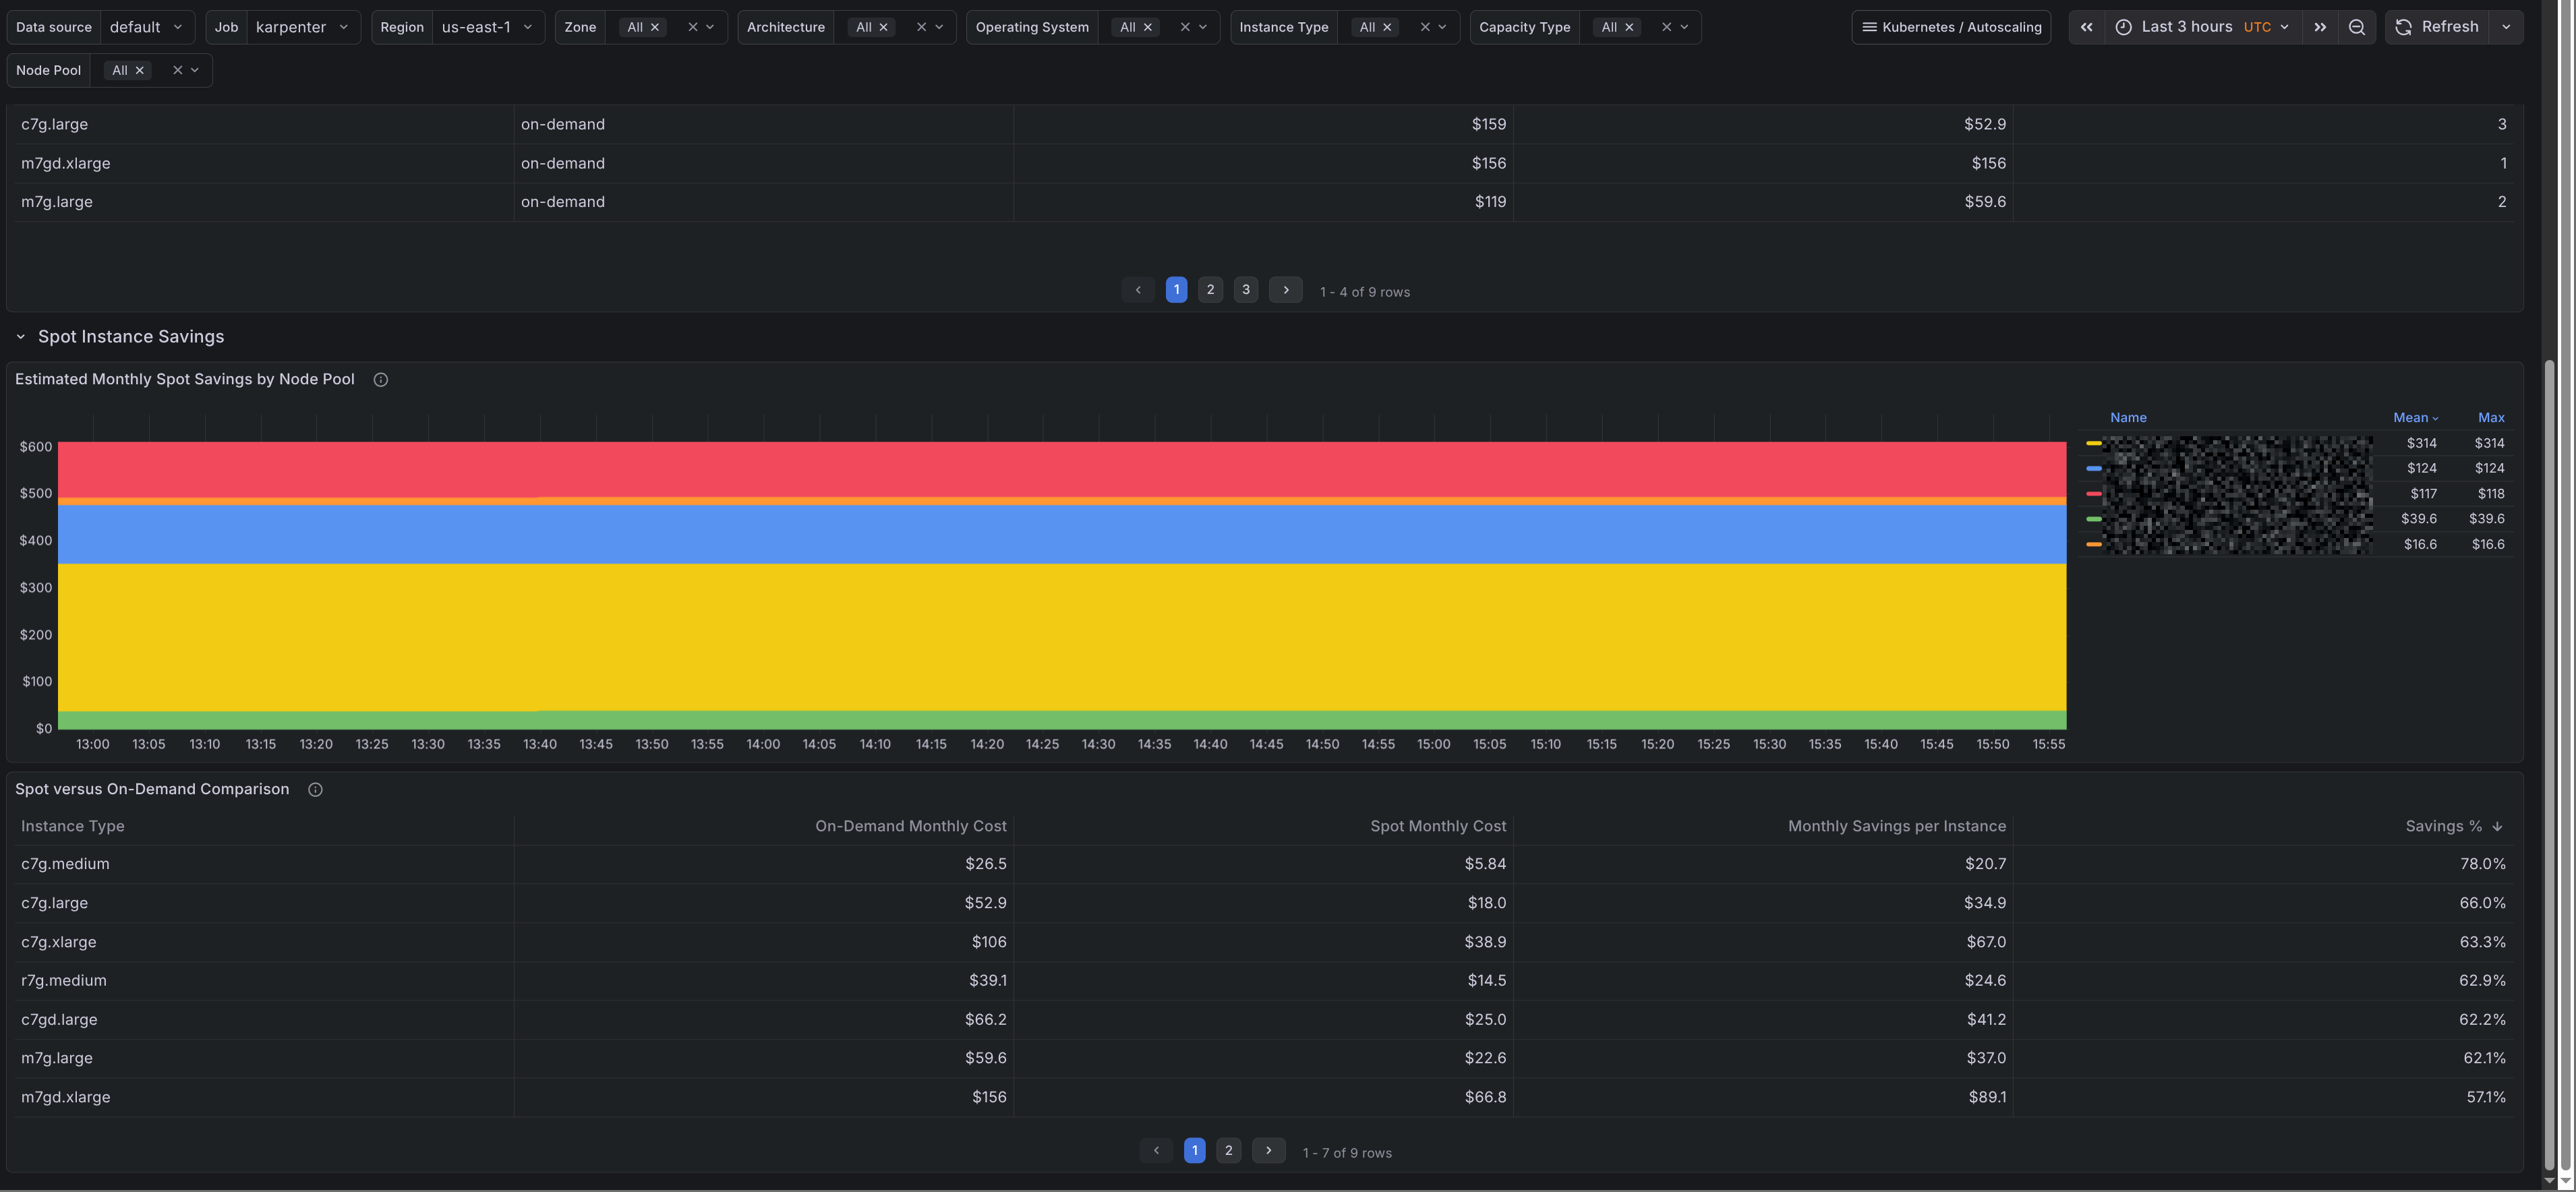
Spot savings
The second section compares spot and on-demand price estimates for the same instance types and zones.
It shows:
- estimated monthly spot savings by node pool
- a spot versus on-demand table with monthly cost, savings in dollars, and savings percentage
This is useful when you want to see whether a node pool is getting real value from spot capacity.
Where this fits next to OpenCost
OpenCost is still the right tool for full Kubernetes cost analysis and allocation. This dashboard answers a narrower question: what the current Karpenter-managed node fleet looks like in dollars.
That makes it useful for day-to-day tuning, such as checking which node pools cost the most, how much of the fleet is still on on-demand, and whether an instance mix change is reducing spend.
Limits
The dashboard is an estimate, not billing data.
- prices can vary by zone and capacity type over time
- it reflects the current fleet rather than a full bill
- spot savings are based on Karpenter price estimates
- non-node costs are out of scope
Summary
The new Karpenter cost dashboard in the kubernetes-autoscaling-mixin gives a practical estimate of current node spend, spot instance savings, and node pool cost distribution using only Karpenter metrics already in Prometheus. It is a good fit for cluster operators who want quick cost feedback while tuning node pools, capacity types, and instance selections.
For billing accuracy, allocation by namespace, or broader Kubernetes cost analysis, keep OpenCost in the stack. For fast answers about what Karpenter is doing to your node bill right now, this dashboard is the missing piece.