KEDA is a tool that provides event-driven autoscaling for Kubernetes, allowing you to scale your applications based on external metrics. It uses the Kubernetes Horizontal Pod Autoscaler (HPA) to adjust the number of pods in a deployment based on metrics like CPU usage, memory usage, or custom metrics from external sources. It also supports scaling based on event sources like message queues, databases as a job and defines a new Custom Resource Definition (CRD) called ScaledJob to configure the scaling behavior. Monitoring KEDA effectively is crucial to ensure that your autoscaling policies are working as expected and that your applications are performing optimally.
I've written multiple blog posts on Kubernetes autoscaling monitoring, including Comprehensive Kubernetes Autoscaling Monitoring with Prometheus and Grafana, Karpenter Monitoring with Prometheus and Grafana and Configuring VPA to Use Historical Metrics for Recommendations and Expose Them in Kube-state-metrics. This post focuses on monitoring KEDA with Prometheus and Grafana, but is still be apart of the same Github repository as the other posts, so you can find all the code and configuration files in one place.
The repository is the kubernetes-autoscaling-mixin on Github. It contains Grafana dashboards and Prometheus rules for KEDA, HPA, VPA, Cluster Autoscaler, PDBs, and Karpenter.
There are already two dashboards that published in Grafana:
- Scaled Object - An overview of
ScaledObjects, including the total count and their status, with insights into scaling activity and errors. - Scaled Job - An overview of
ScaledJobs, including the total count and their status, with insights into scaling activity and errors.
There are also Prometheus alerts stored in GitHub that you can import that cover the common KEDA issues.
Enabling Metric Collection for KEDA
To monitor KEDA, you need to enable metric collection. This is typically done by deploying the KEDA operator in your Kubernetes cluster. The operator automatically collects metrics from your scaled jobs and scaled objects.
Using Helm, you should deploy KEDA with the following values:
prometheus:
  metricServer:
    enabled: true
    serviceMonitor:
      enabled: true
  operator:
    enabled: true
    serviceMonitor:
      enabled: true
  webhooks:
    enabled: true
    serviceMonitor:
      enabled: true
This configuration enables the Prometheus metric server, the KEDA operator, and webhooks service monitors. The service monitors allow Prometheus to scrape metrics from KEDA components using the Prometheus-operator.
Grafana Dashboards
Upcoming sections describe each dashboard.
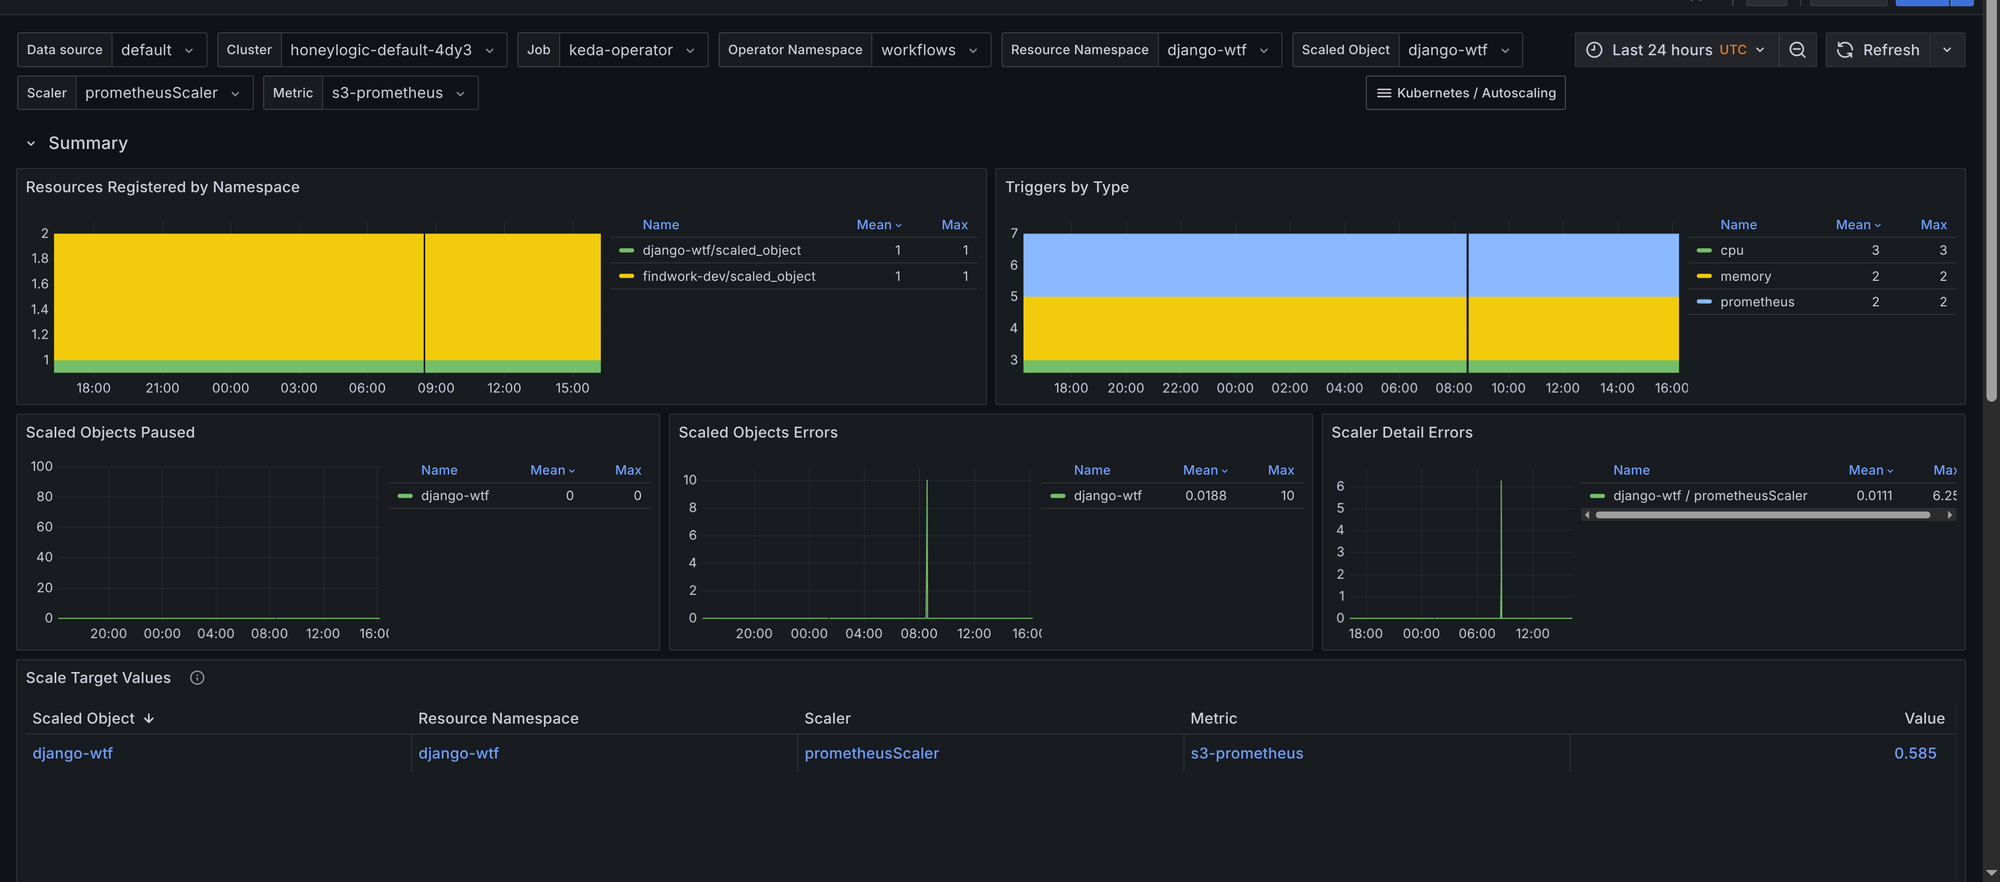
Scaled Objects
The Grafana dashboard for Scaled Objects provides insights into KEDA's scaled objects. Its panels include:
- Summary - Provides an overview of
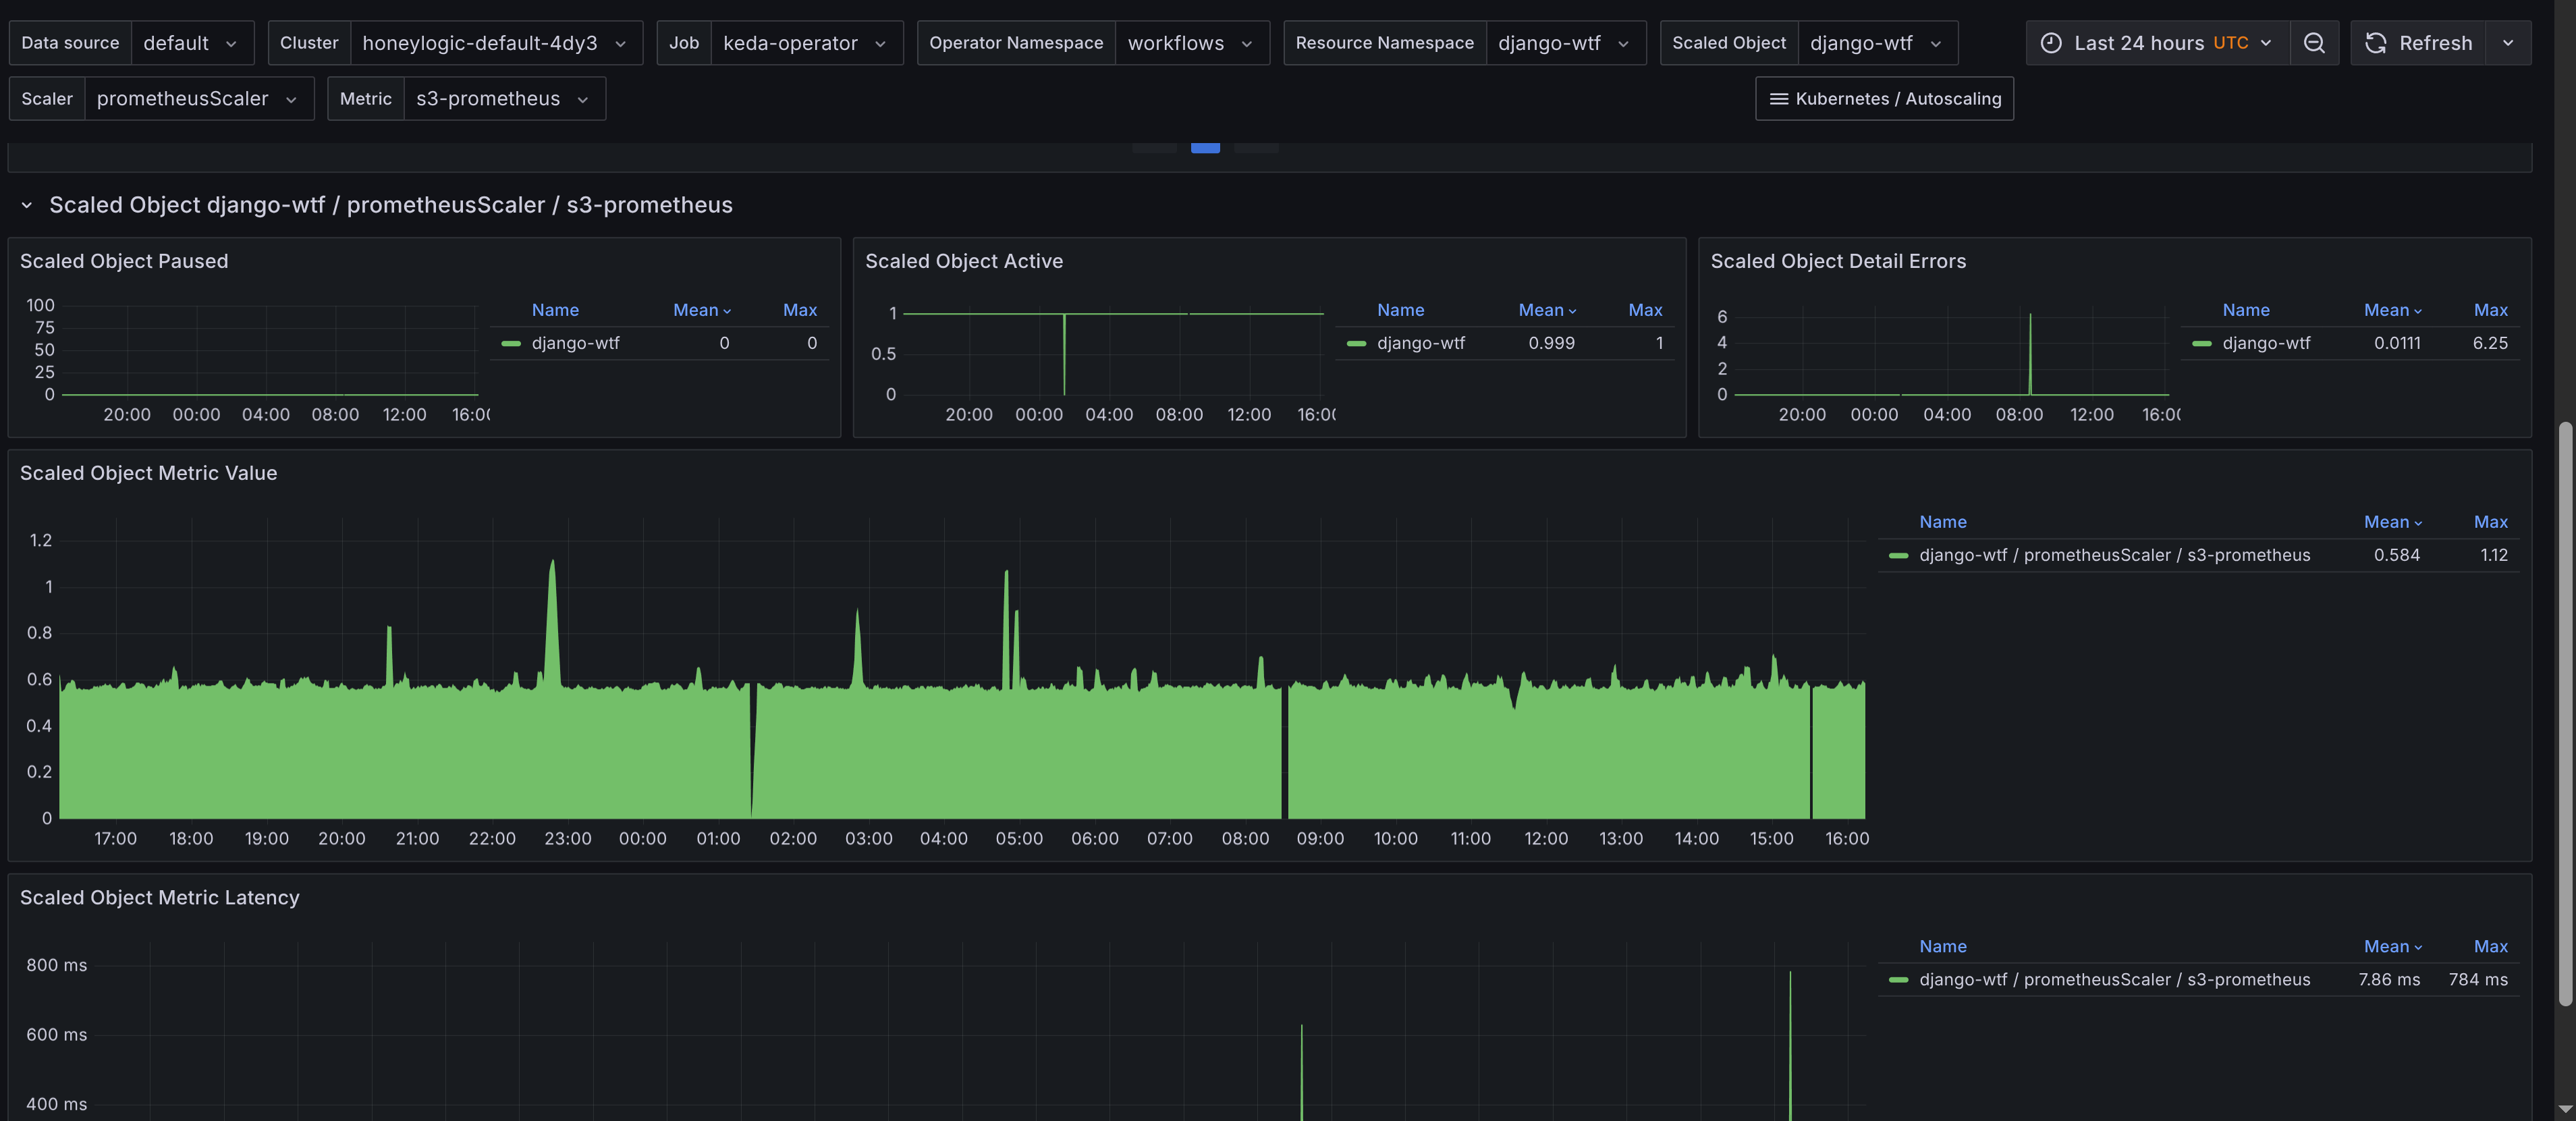
ScaledObjects, including the total count and their status. Provides a table of scaled objects, their namespaces, and their types with links to the Horizontal Pod Autoscalers (HPAs) dashboard for further scaling insights. This allows you to quickly navigate to the HPA dashboard for more detailed scaling information. The requirement is to add Horizontal Pod Autoscaler dashboard to your Grafana instance, which is available in the kubernetes-autoscaling-mixin and on Grafana's dashboard page. ScaledObjectby object, scaler and metric - Displays scaled objects grouped by their associated scaler and metric, providing a clear view of how each scaled object is configured. Gives insights to latency of metric collection for scaled objects, which can impact scaling decisions and also the value of the metric used for scaling.

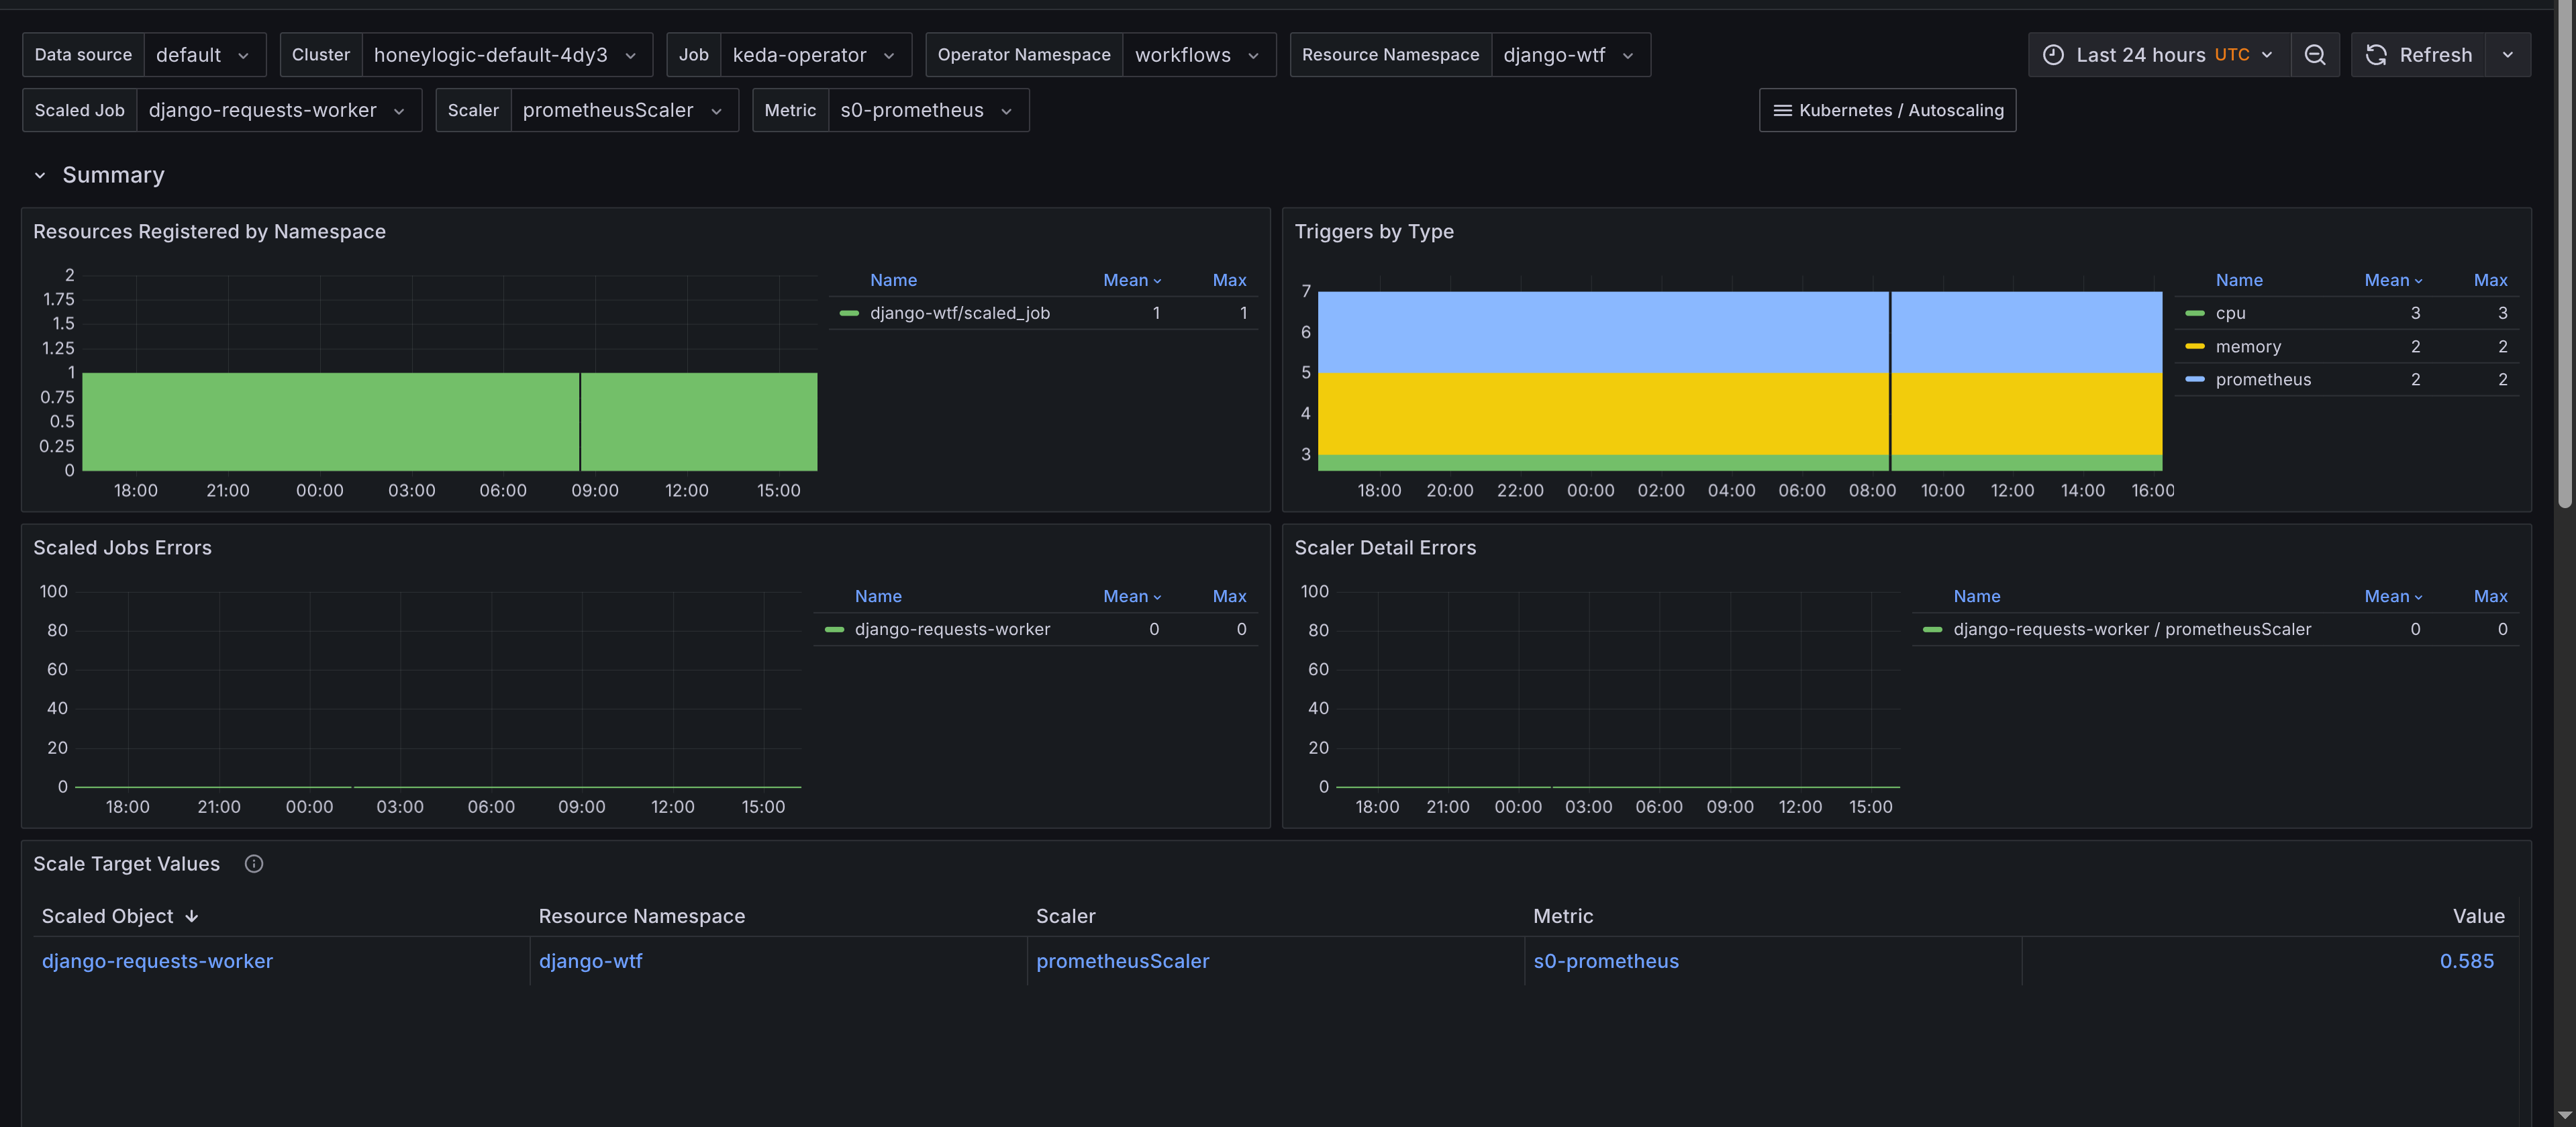
Scaled Jobs
The dashboard for Scaled Jobs is similar but tailored towards KEDA-scaled jobs. Monitoring panels include:
- Summary - Provides an overview of
ScaledJobs, including the total count and their status. Has a table of scaled jobs, their namespaces, and their types with links to theKubernetes Workloaddashboard for job insights. This allows you to quickly navigate to the workload dashboard for more scaling insights, showing when jobs are added and resource consumption. The requirement is to add Kubernetes Workload dashboard to your Grafana instance, which is available in the kubernetes-mixin and also to adjust the URL so it's predictable. Thejsonnetlibrary would need the following configuration to be added to theconfig.libsonnetfile:
{
  _config+:: {
    keda+: {
      enabled: true,
      k8sResourcesWorkloadDashboardUid: 'k8s-resources-workload-kd21',
    },
  }
}
Also, you would need to add the Workload dashboard to your Grafana instance using that specific ID. If you are using kube-prometheus then an IaC way of doing so would be:
    // This provides stable links for our KEDA Scaled Job dashboards.
    kubernetesControlPlane+: {
      mixin+: {
        _config+: {
          grafanaDashboardIDs+: {
            'k8s-resources-workload.json': 'k8s-resources-workload-kd21',
          },
        },
      },
    },
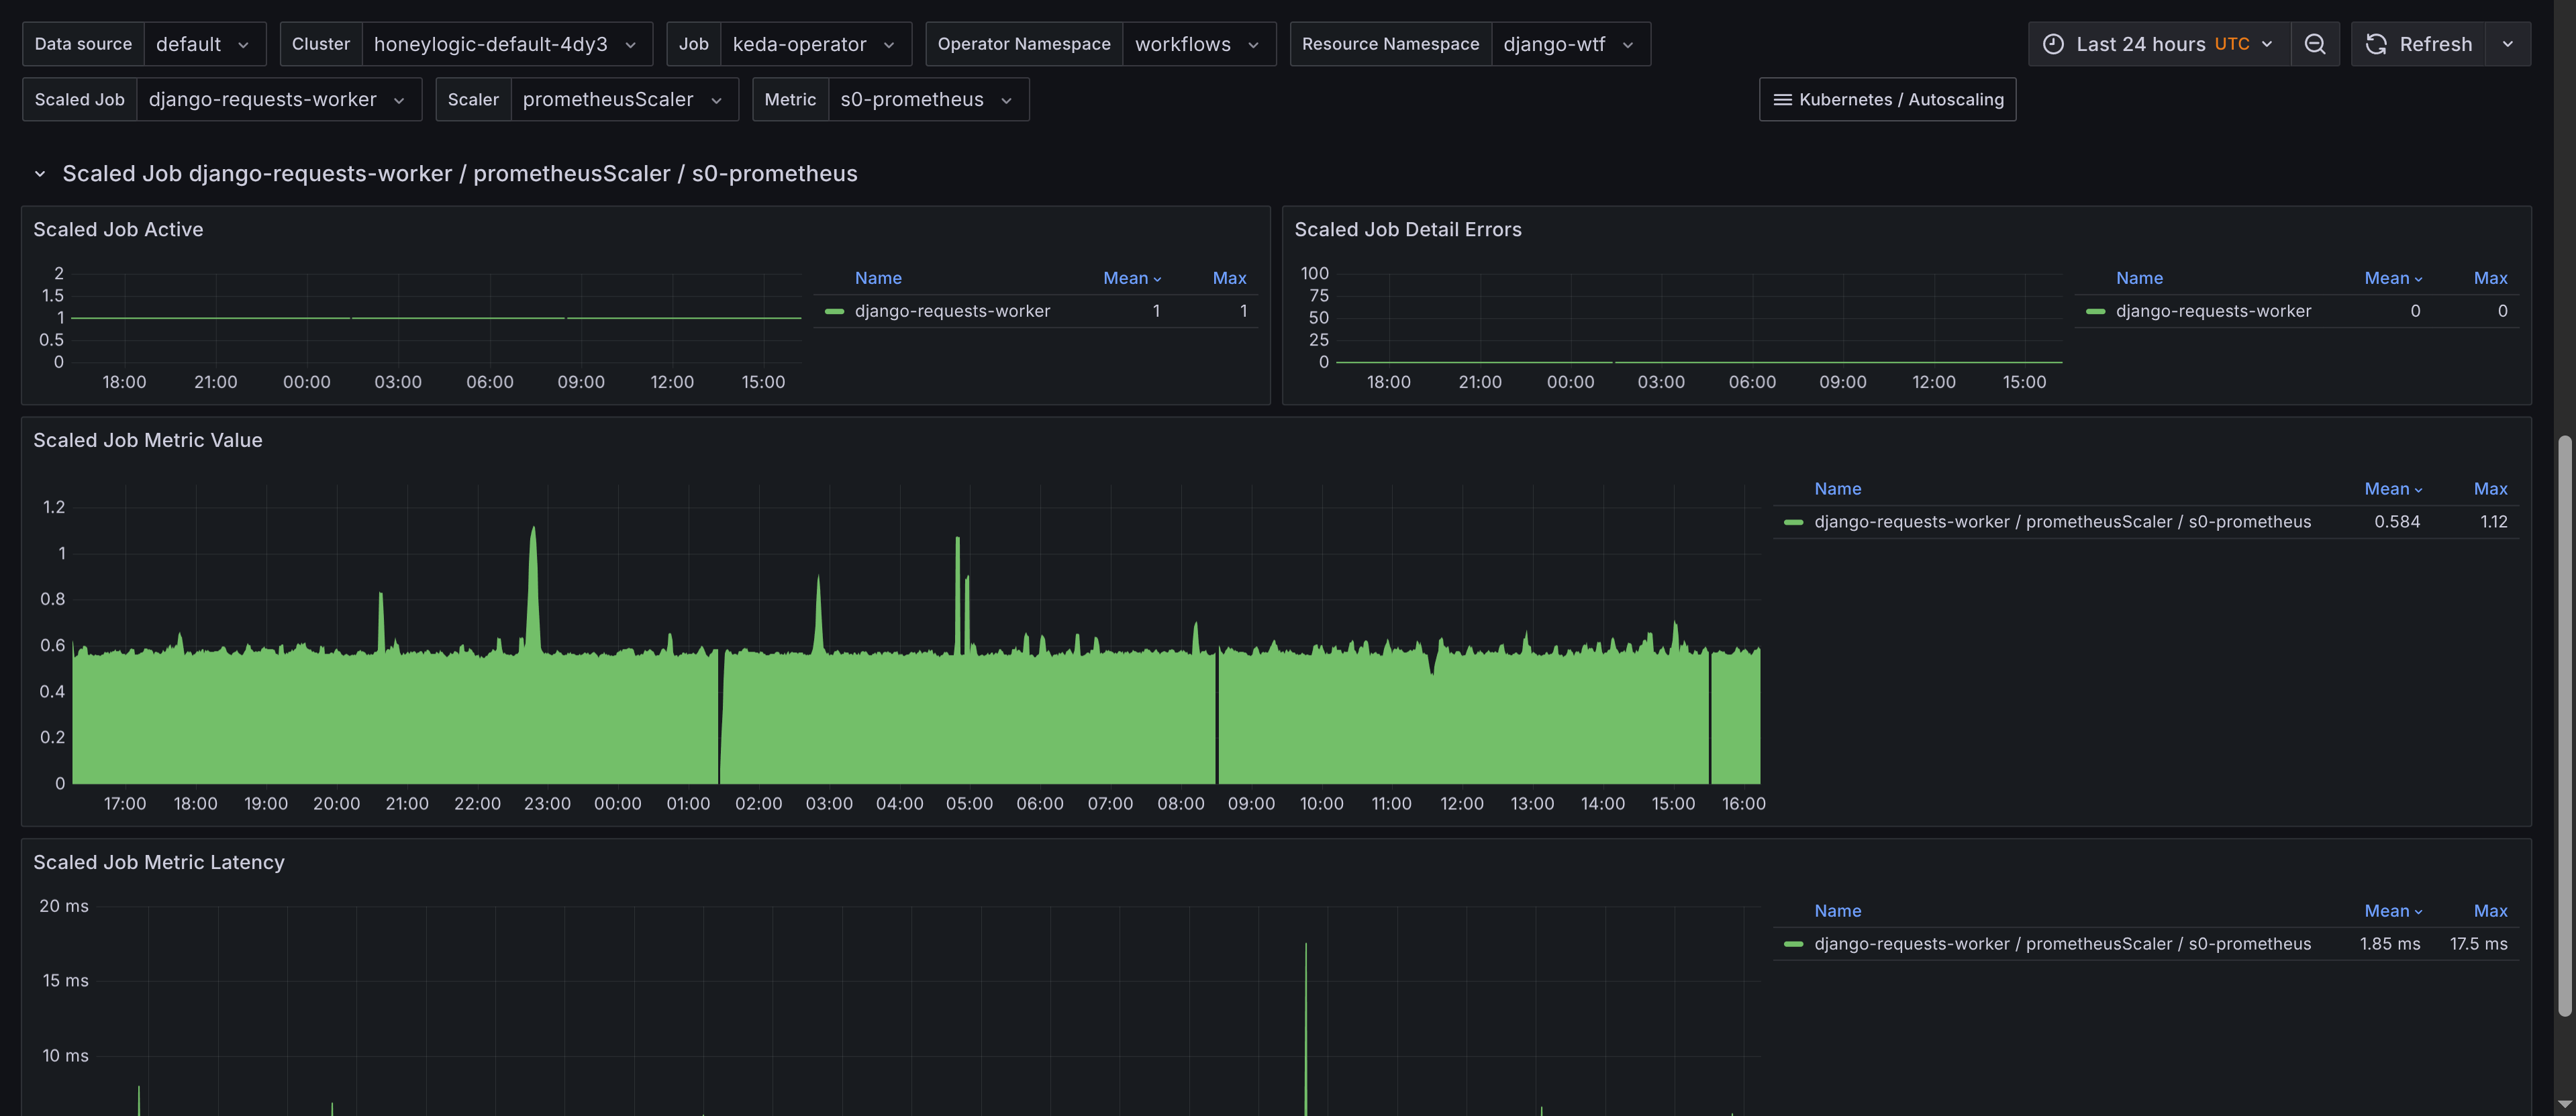
ScaledJobby job, scaler and metric - Displays scaled jobs grouped by their associated scaler and metric, providing a clear view of how each scaled job is configured. Gives insights to latency of metric collection for scaled objects, which can impact scaling decisions and also the value of the metric used for scaling.
Prometheus Alerts
Alerts are trickier to get right for a generic use case, however they're still provided by the Kubernetes-autoscaling-mixin. They're also configurable with the config.libsonnet package in the repository, if you are familiar with Jsonnet then customizing the alerts should be fairly straight forward. Alerts are available on GitHub, and I'll add a description for the alerts below.
- Alert name:
KedaScaledJobErrors
Alerts when KEDA scaled jobs encounter errors.
- Alert name:
KedaScaledObjectErrors
Alerts when KEDA scaled objects encounter errors.
- Alert name:
KedaScalerLatencyHigh
Alerts when the latency of KEDA scaled object metrics is high. This indicates that the time taken to collect metrics for scaled objects has increased significantly, potentially impacting scaling decisions. The default threshold is set to 5 seconds, but you can adjust it based on your requirements.
- Alert name:
KedaScaledObjectPaused
Alerts when a scaled object is paused. This indicates that the scaled object isn't processing scaling triggers, which could lead to performance issues or resource underutilization. The default threshold is set to 24 h as the pause can be intentional, but you can adjust it based on your requirements.
- Alert name:
KedaScalerDetailErrors
Alerts when KEDA scaler detail errors occur. This indicates that there are issues with some parts of the scaler, which could lead to incorrect scaling decisions. It might be that you can't fetch Prometheus metrics or that the scaler is not configured correctly.