Kubernetes, Docker, and tailnet services often end up split across ingress objects, container labels, private DNS names, Grafana dashboards, runbooks, and a self-hosted homepage that has to be updated by hand. Compass turns those sources into a searchable service dashboard by discovering Kubernetes HTTPRoute, GRPCRoute, and Ingress resources, Docker containers, Tailscale devices and services, Headscale nodes, static YAML, and JSON APIs.
The documentation is at adinhodovic.github.io/compass, and the demo page has screenshots of the dashboard, service detail pages, markdown pages, and debug view. Compass is a single Go binary with server-rendered HTML, HTMX for small interactions, Tailwind CSS, daisyUI, and no SPA runtime. It sits near self-hosted dashboards such as Homepage, Homarr, and Homer, but with a different bias: discover services from the systems that already know about them and keep manual config small.
Why Compass exists
Most service dashboards start accurate and slowly drift away from reality. A new service gets deployed, the homepage card is forgotten, the Grafana dashboard lives somewhere else, and the runbook links are copied into Slack instead of the place operators actually look.
Compass treats the dashboard as a view over sources rather than a hand-maintained list. Add a Kubernetes source and it reads routes. Add a Docker source and it reads labels. Add Tailscale or Headscale and it reads tailnet devices. Static YAML and JSON API sources cover the systems that do not need a dedicated integration.
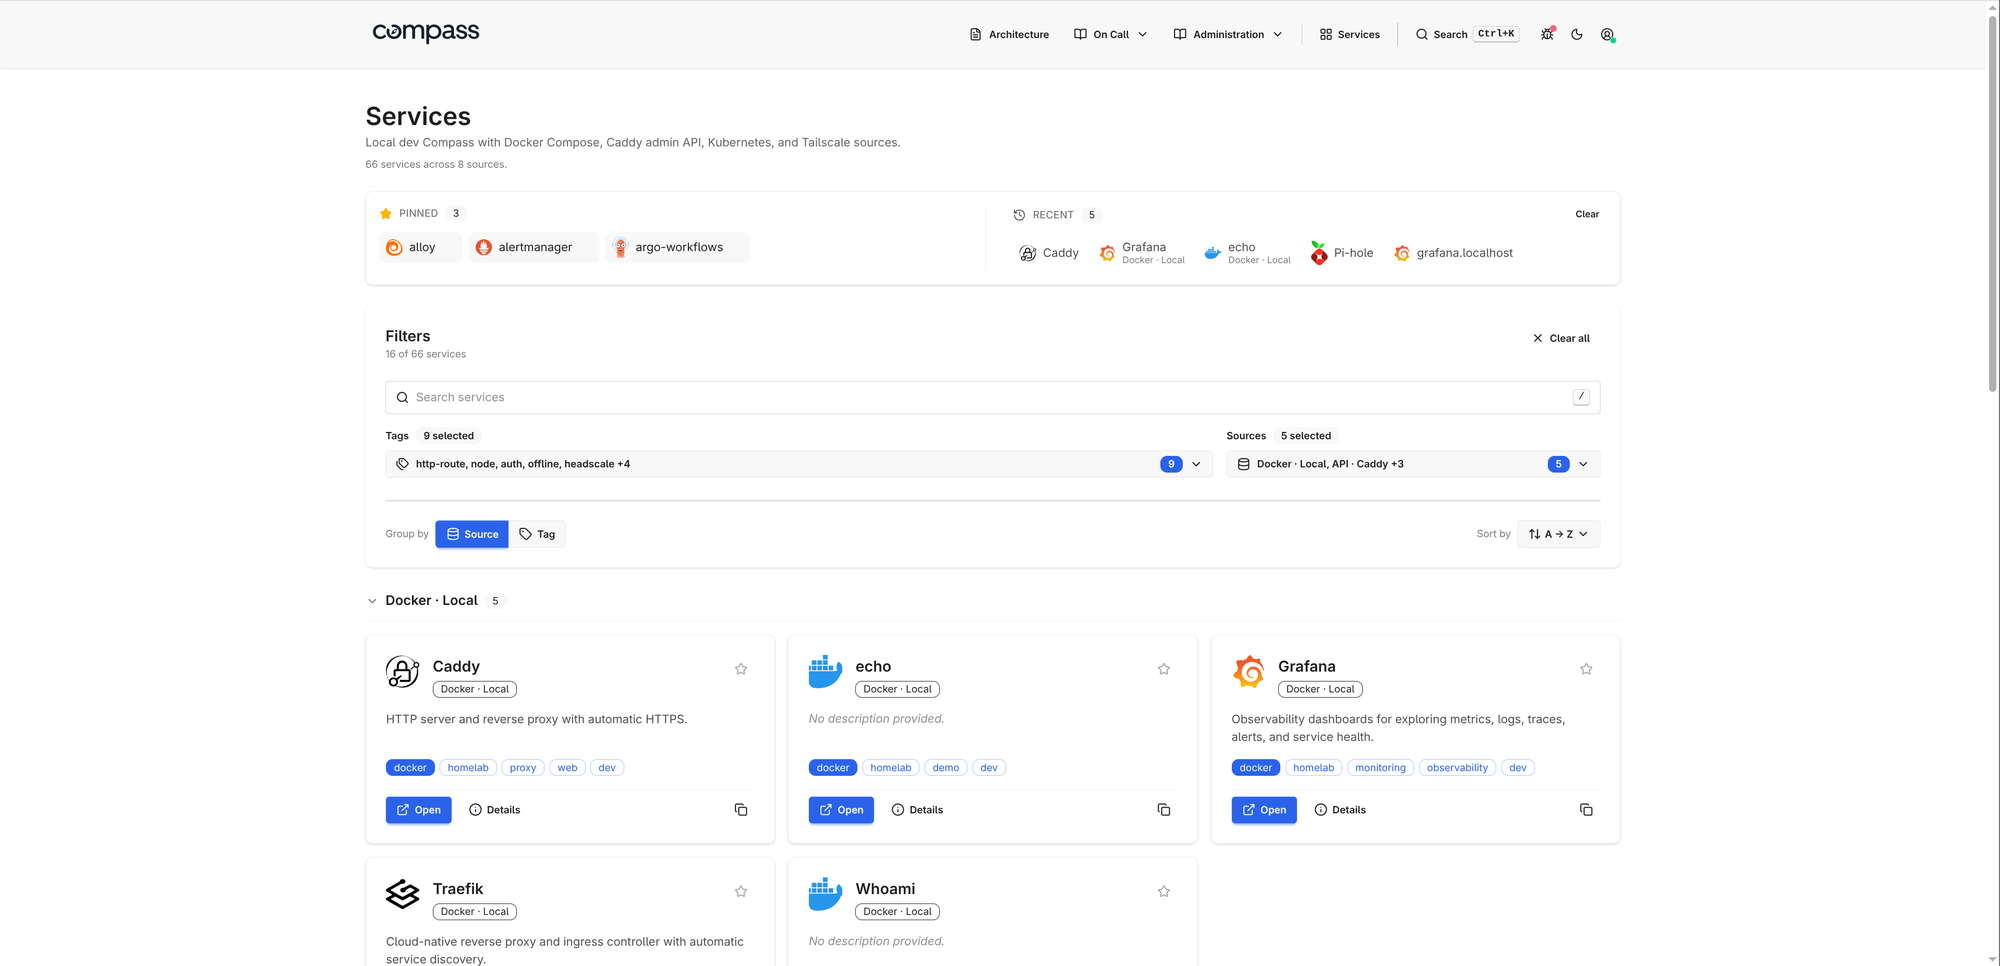
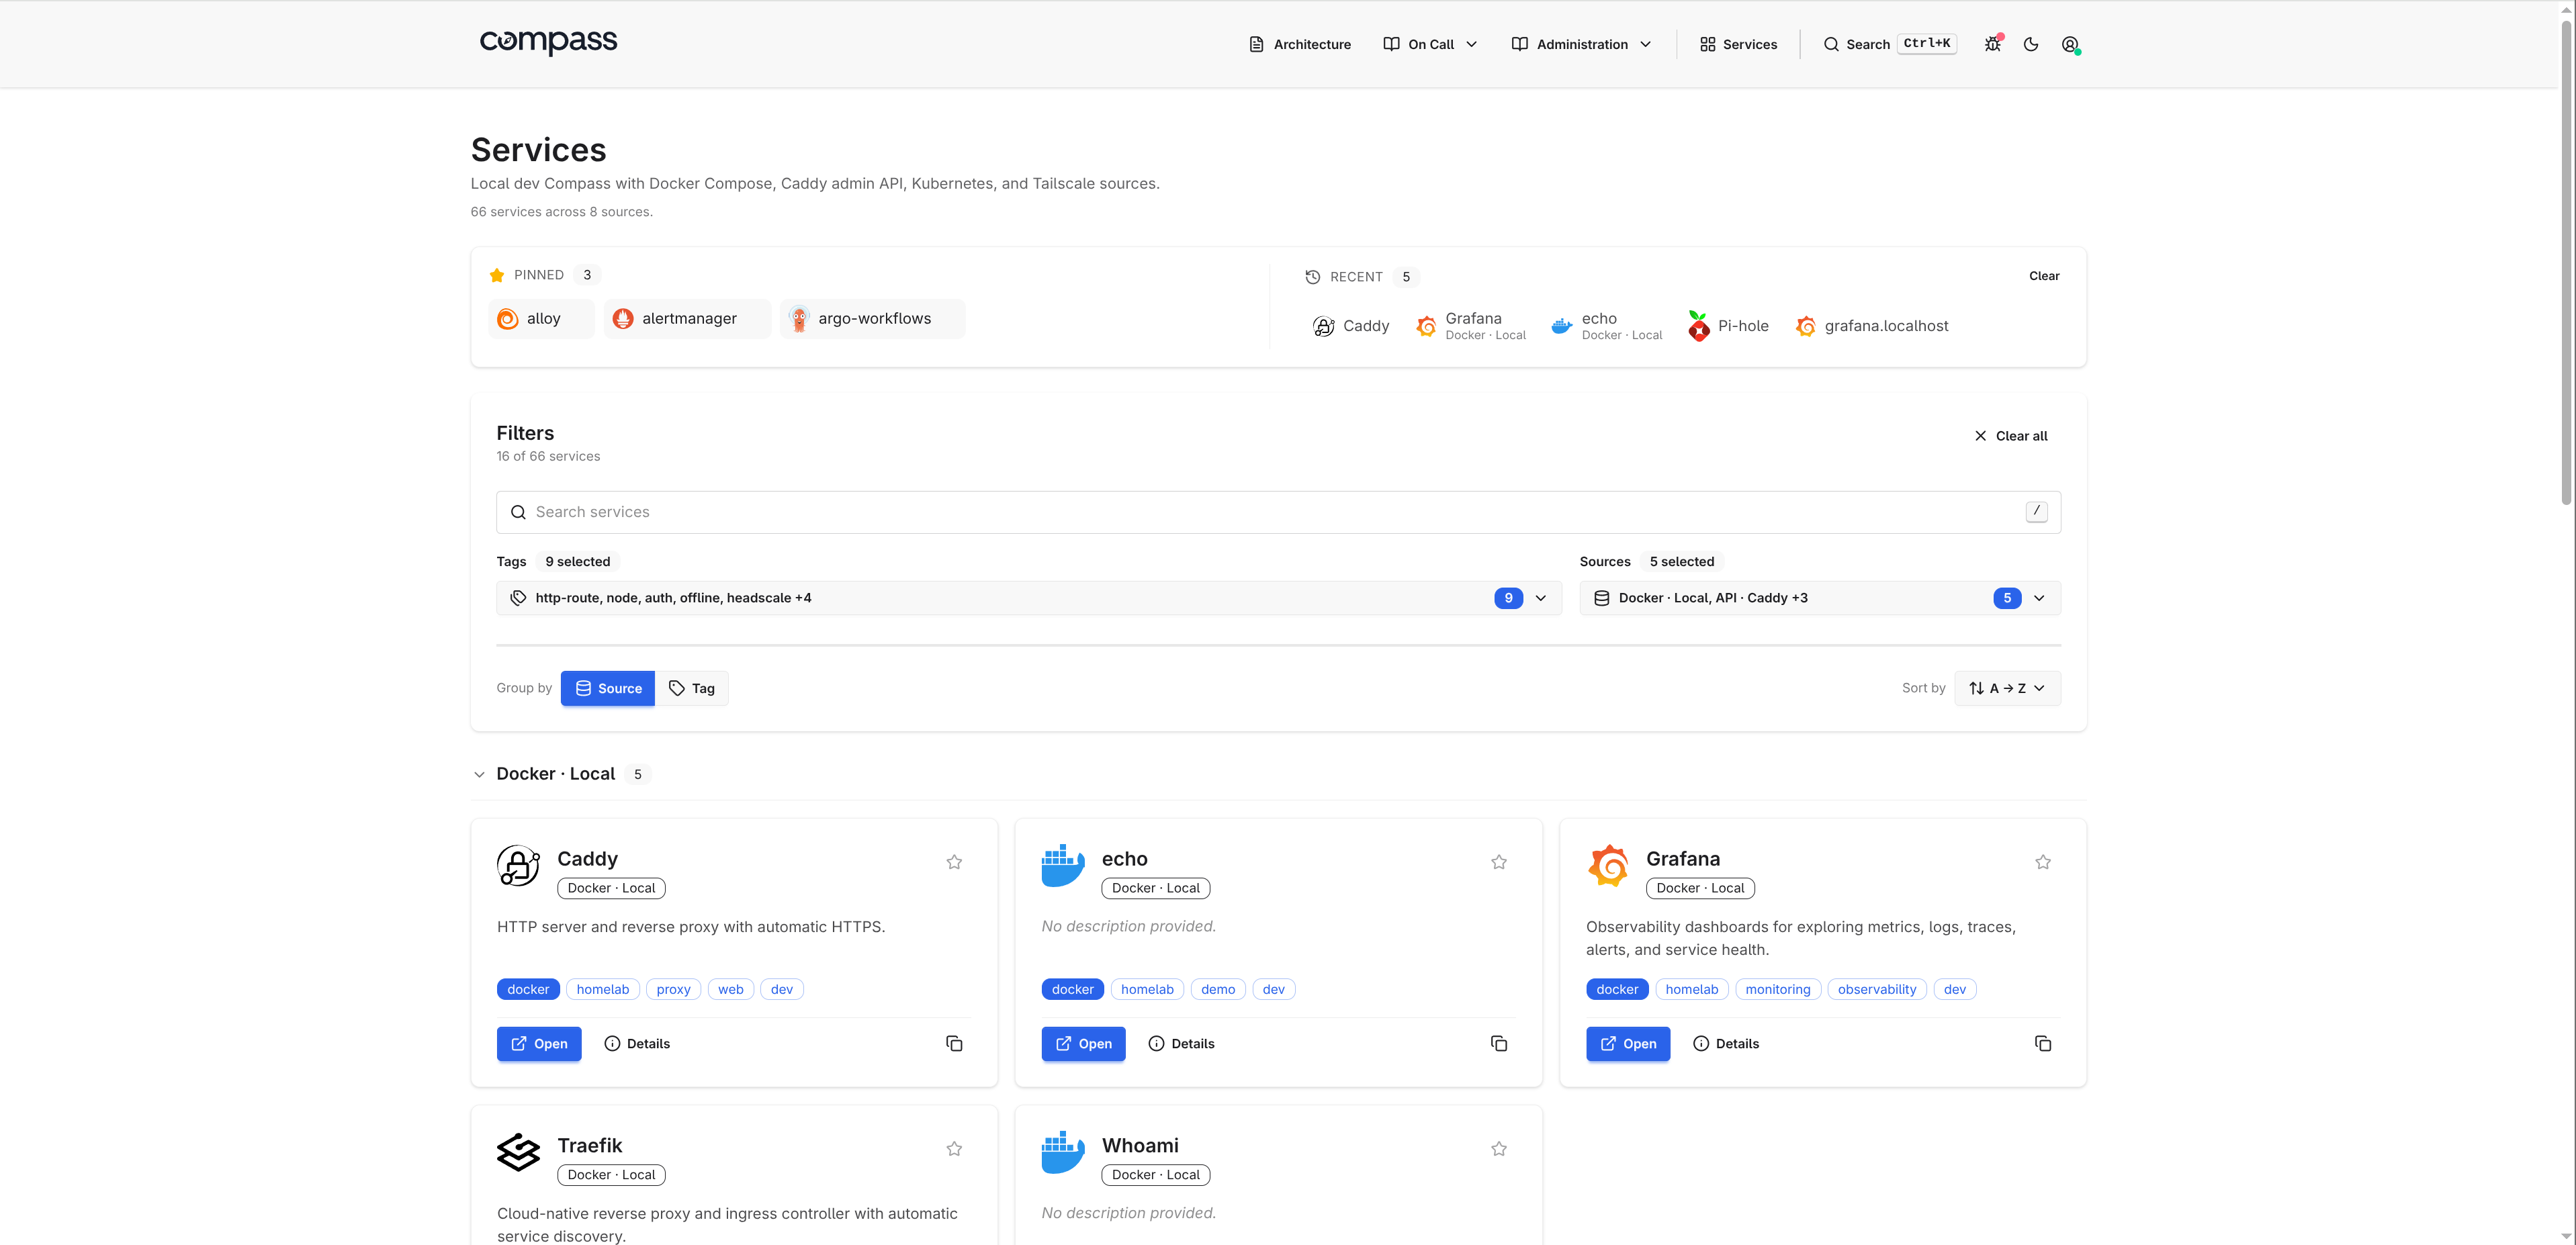
Compass gives you:
- source health and refresh status
- searchable service cards
- tags, metadata, icons, and descriptions
- service detail pages
- embedded Grafana panels
- markdown pages for runbooks and architecture notes
/debug,/health, and/metricsendpoints for operations
Homelab dashboard alternative to Homepage, Homarr, and Homer
Compass can be used as a homelab dashboard, a self-hosted services homepage, or a small internal developer portal. The difference is where the data comes from.
Tools like Homer work well when you want a simple static list of links. Homarr and Homepage add more widgets and integrations. That model is fine, but it can turn into another place to maintain service definitions.
Compass tries to keep the source of truth closer to the workload:
- Kubernetes services come from
Ingress,HTTPRoute, andGRPCRouteobjects. - Docker services come from container labels, including existing Traefik
Host(...)labels when possible. - Tailnet services come from Tailscale or Headscale.
- Static YAML is still available for bookmarks and services with no discovery source.
Compass is a lighter fit when the goal is a searchable service discovery dashboard rather than a widget-heavy homepage. You can still hand-curate entries, add icons, embed Grafana panels, and write runbooks, but the common case should not require copying every URL into another config file.
Quick start
For a local Docker setup, create a minimal compass.yaml:
organization:
  name: Homelab

services:
  sources:
    - type: docker
      name: local
Then run the container:
docker run --rm -p 8080:8080 \
  --group-add $(getent group docker | cut -d: -f3) \
  -v /var/run/docker.sock:/var/run/docker.sock:ro \
  -v $PWD/compass.yaml:/etc/compass/compass.yaml:ro \
  adinhodovic/compass:latest \
  -c /etc/compass/compass.yaml
Open http://localhost:8080/.
For Kubernetes, use the Helm chart:
organization:
  name: Homelab

services:
  sources:
    - type: kubernetes
      name: cluster
      kubernetes:
        namespaces: []
helm install compass oci://ghcr.io/adinhodovic/charts/compass \
  -n compass --create-namespace \
  --set-file config=compass.yaml
The Helm chart includes the usual Kubernetes wiring, including a ServiceMonitor option for Prometheus scraping.
Kubernetes service discovery dashboard
The Kubernetes source is the main reason I built Compass. I wanted a Kubernetes service discovery dashboard that reads the cluster rather than another YAML file with duplicated links.
Compass discovers:
- Gateway API
HTTPRouteresources - Gateway API
GRPCRouteresources - Kubernetes
Ingressresources
Each hostname becomes a service card. A route with multiple hostnames emits multiple services, which matches how operators usually think about entry points: one URL, one thing to open.
services:
  sources:
    - type: kubernetes
      name: prod
      kubernetes:
        namespaces: []
        auto_discover_all: true
When Compass runs inside the same cluster, it uses the pod's ServiceAccount. Give that account read-only access to list and watch httproutes, grpcroutes, and ingresses.
For remote clusters, configure the API server and a read-only token:
services:
  sources:
    - type: kubernetes
      name: prod-east
      kubernetes:
        cluster_url: https://prod-east.k8s.example.com:6443
        cluster_ca_file: /etc/compass/prod-east-ca.crt
        bearer_token: ${PROD_EAST_K8S_TOKEN}
        namespaces: []
        auto_discover_all: true
You can annotate Kubernetes resources when the route hostname is not the URL an operator should open:
metadata:
  annotations:
    compass.adinhodovic.com/name: Grafana
    compass.adinhodovic.com/urls: "Grafana=https://grafana.example.com"
    compass.adinhodovic.com/description: Dashboards and alerts
    compass.adinhodovic.com/icon: dashboardicons:grafana
    compass.adinhodovic.com/primary-tag: observability
    compass.adinhodovic.com/tags: observability,core
The compass.adinhodovic.com/enabled label controls discovery. With auto_discover_all: true, set enabled=false to exclude a route. With auto_discover_all: false, set enabled=true to opt in only the routes you want.
Docker service discovery and Traefik labels
The Docker source reads container labels and turns them into services. This works well for Docker Compose stacks because labels already travel with the service definition.
services:
  sources:
    - type: docker
      name: local
      docker:
        host: /var/run/docker.sock
        auto_discover_all: true
        include_stopped: false
        url_scheme: https
A container can expose explicit Compass labels:
labels:
  compass.adinhodovic.com/urls: https://grafana.local
  compass.adinhodovic.com/primary-tag: observability
  compass.adinhodovic.com/tags: observability,core
  compass.adinhodovic.com/icon: dashboardicons:grafana
For Docker Compose stacks that already use Traefik, Compass can also infer services from Traefik Host(...) labels when no explicit Compass URL label is set.
labels:
  traefik.http.routers.grafana.rule: Host(`grafana.local`)
This lets existing Compose stacks show up without a separate Traefik integration. Compass does not query the Traefik API, parse Traefik config files, or read the file provider. It only reads labels already present on Docker containers.
Docker socket access deserves care. Compass reads container metadata, but access to /var/run/docker.sock can still control the host through the Docker daemon. For shared deployments, put a restricted socket proxy such as tecnativa/docker-socket-proxy in front of Docker and point Compass at that instead.
Tailscale and Headscale services
Compass can use Tailscale as a source for devices, and it can opt in to Tailscale Services when that API is available for your tailnet.
services:
  sources:
    - type: tailscale
      name: tailnet
      tailscale:
        tailnet_id: example.com
        oauth_client_id: ${TAILSCALE_OAUTH_CLIENT_ID}
        oauth_client_secret: ${TAILSCALE_OAUTH_CLIENT_SECRET}
        url_scheme: https
        tags: [tailscale]
Headscale works through its gRPC API:
services:
  sources:
    - type: headscale
      name: headscale
      tags: [vpn, headscale]
      headscale:
        address: headscale.example.com:50443
        api_key: ${HEADSCALE_API_KEY}
        url_scheme: http
That matches a lot of homelab setups: some services are exposed through Kubernetes, some through Docker, and some only exist as private tailnet devices.
Static YAML and JSON API sources
Not every system needs a dedicated source. Compass has a static source for hand-written services and an api source for anything that returns JSON.
Static YAML covers links that have no discovery system behind them:
services:
  sources:
    - type: static
      name: manual
      tags: [homelab]
      services:
        - name: Grafana
          url: https://grafana.local
          primary_tag: observability
          tags: [observability]
          metadata:
            environment: prod
The API source maps JSON fields into the same service model. For example, a Consul agent endpoint can be mapped without adding Consul-specific code to Compass:
services:
  sources:
    - type: api
      name: consul
      endpoint: http://consul.local:8500/v1/agent/services
      mapping:
        items_mode: values
        fields:
          name: Service
          url: Meta.url
          tags: Tags
          primary_tag: Meta.primary_tag
The important part is that every source returns the same shape: name, URL, description, icon, tags, metadata, and optional Grafana panels.
Catalog defaults, tags, and metadata
Compass ships with a built-in catalog for common self-hosted tools. If a source only returns Grafana and a URL, Compass can fill in the icon, description, and default tags.
You can override or extend the catalog in YAML:
catalog:
  path: ./catalog.yaml
grafana:
  description: Metrics, logs, traces, and dashboards.
  icon: dashboardicons:grafana
  primary_tag: observability
  tags: [observability]
Tags control grouping, filtering, and search. Metadata appears on the service detail page, which is where source-specific context belongs: Kubernetes namespace and kind, Docker Compose project, tailnet addresses, labels, hostnames, or any custom fields from static YAML.
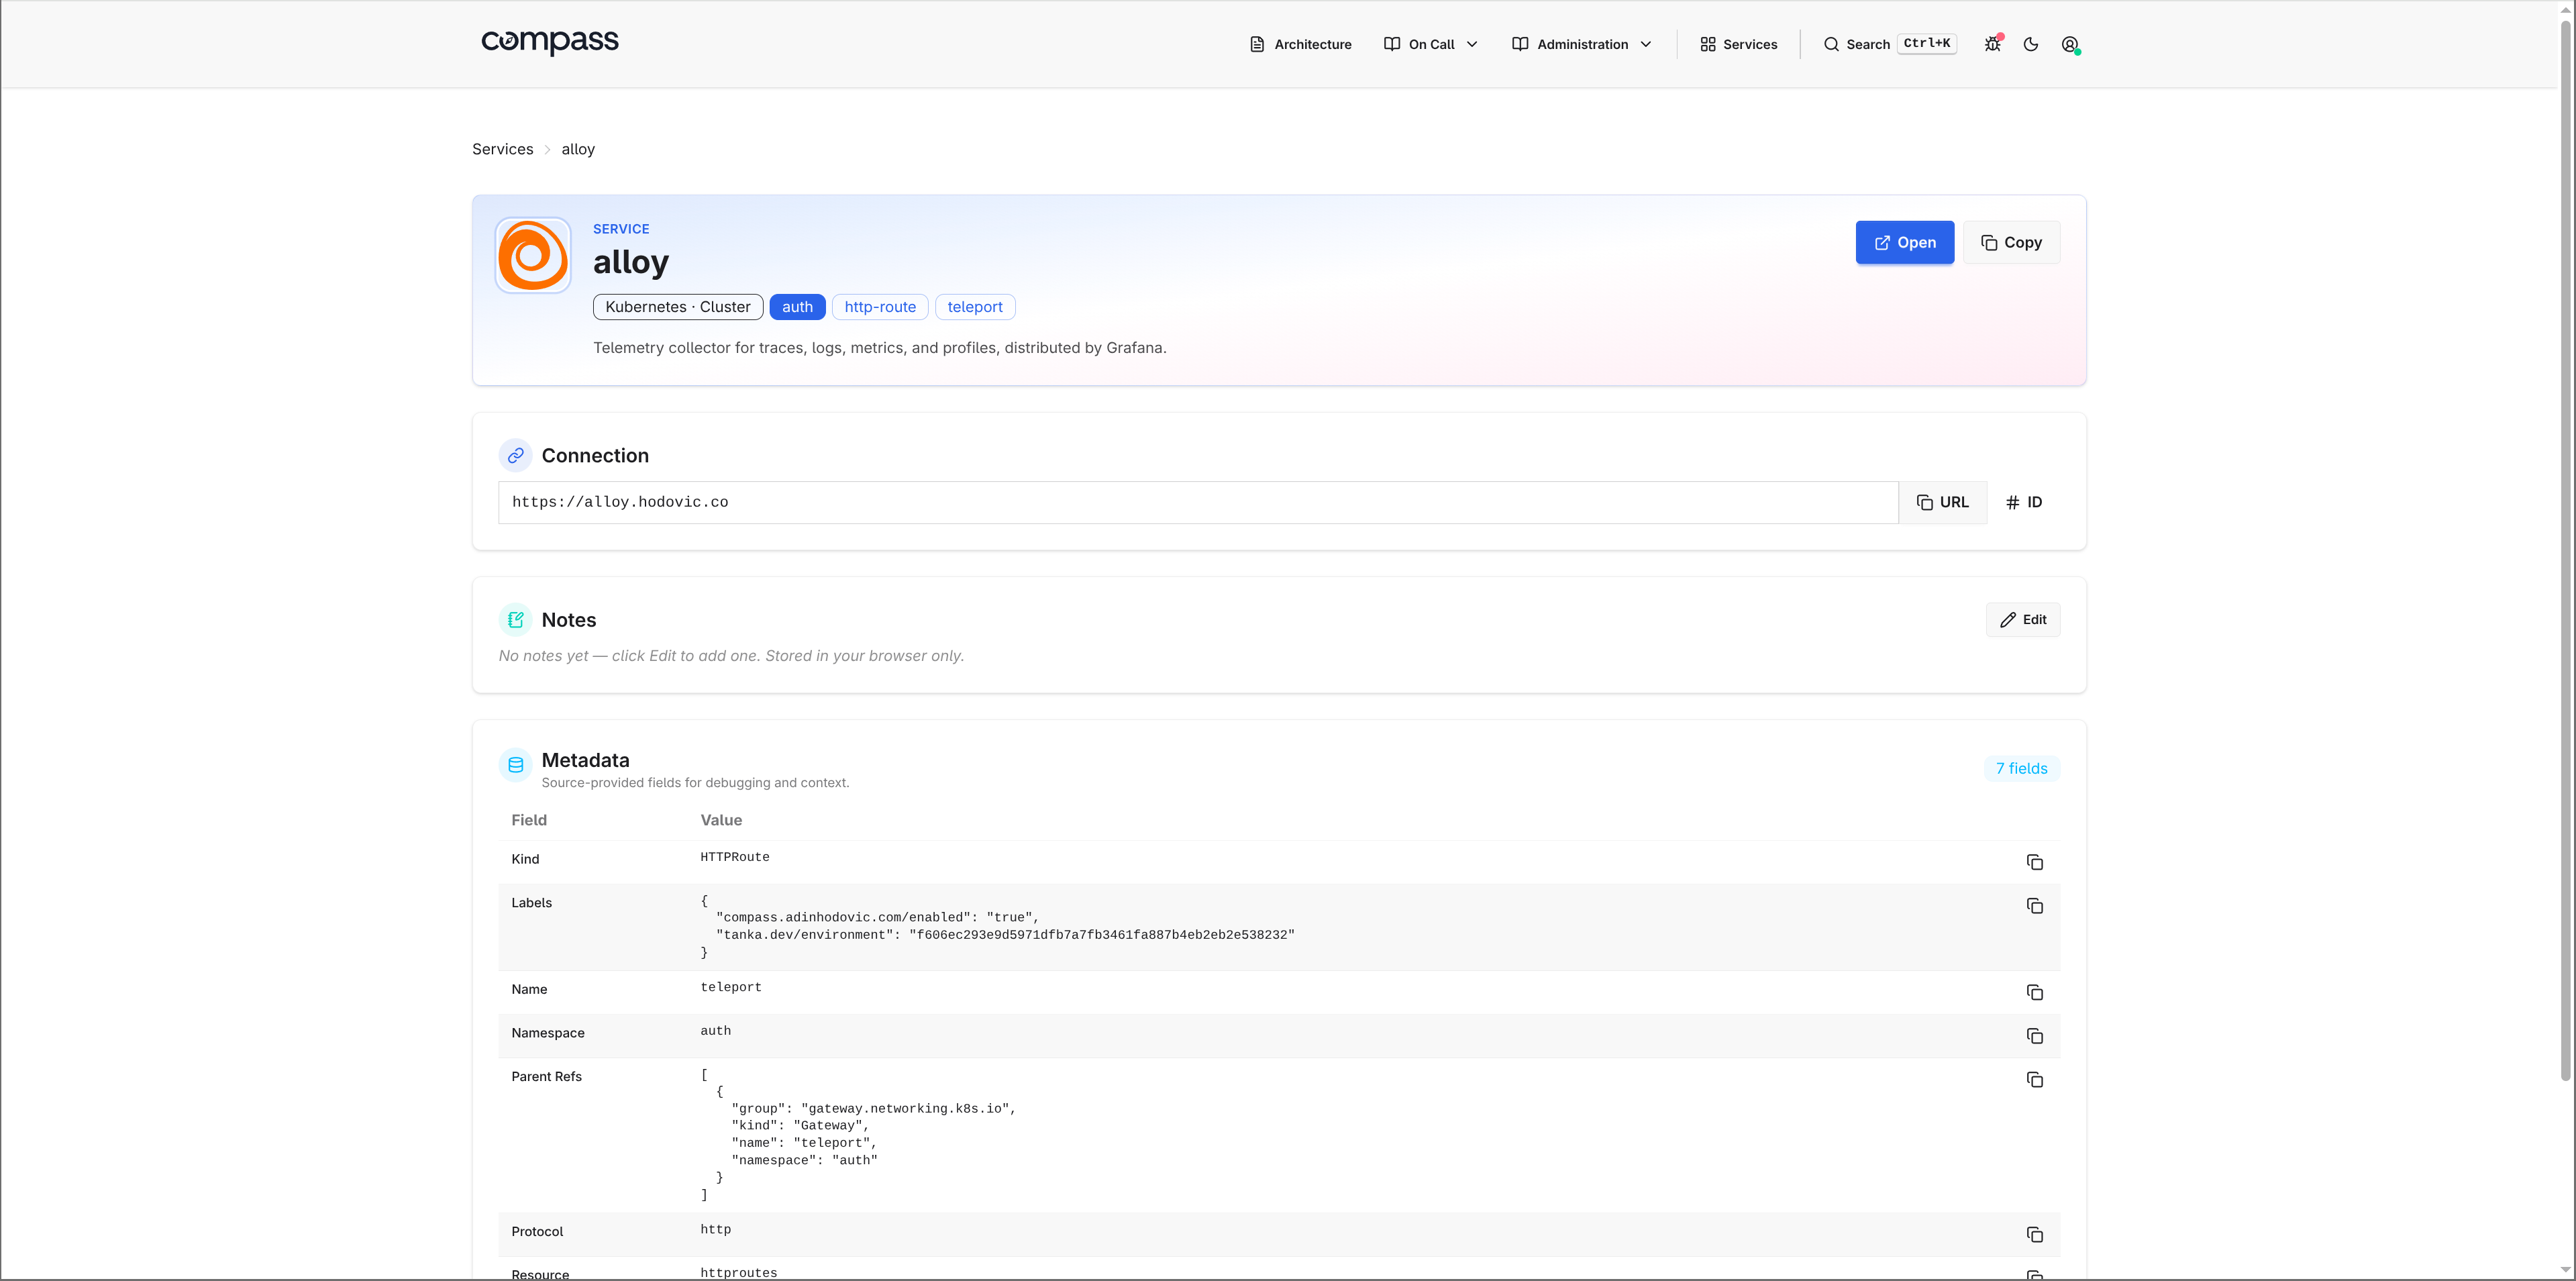
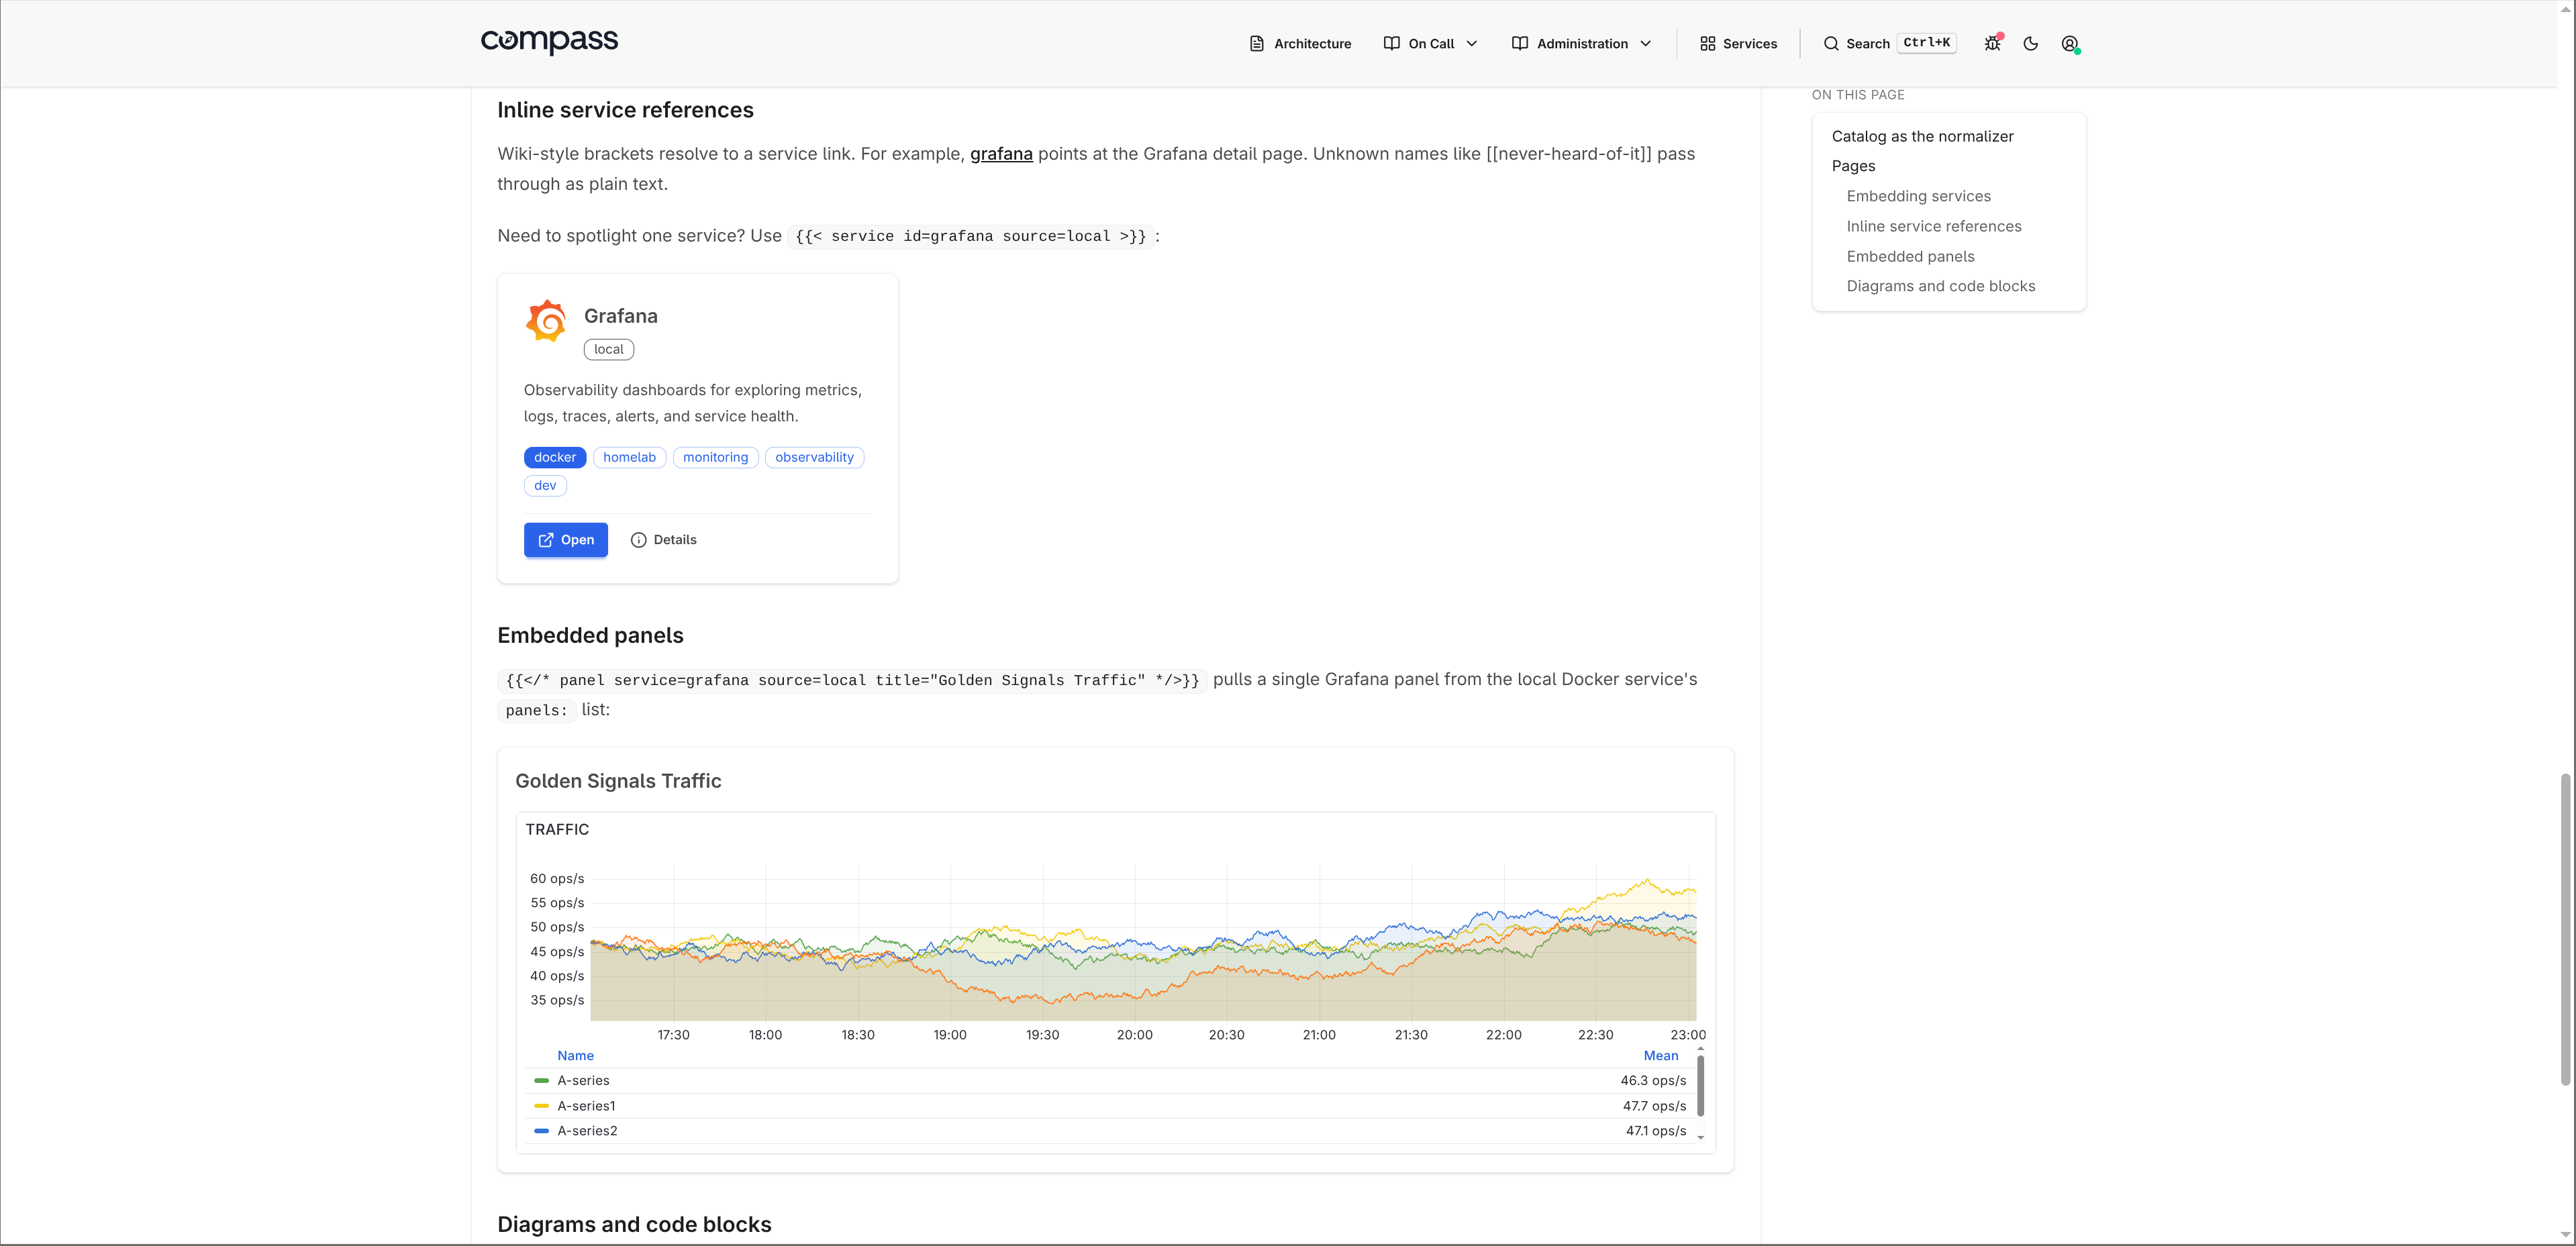
Grafana panels and service pages
Service cards are the entry point. The service detail page is where Compass becomes more than a link dashboard. Each service can include embedded Grafana panels, rendered as iframes.
Static services use a native panels field:
services:
  sources:
    - type: static
      name: manual
      services:
        - name: Grafana
          url: https://grafana.local
          panels:
            - title: Cluster CPU
              url: https://grafana.local/d-solo/cluster/cpu?orgId=1&panelId=2
Kubernetes and Docker use the same grafana-panels annotation or label:
metadata:
  annotations:
    compass.adinhodovic.com/grafana-panels: "CPU=https://grafana.local/d-solo/services?panelId=2&var-service={{service.name}}"
Panel URLs support service placeholders such as {{service.name}}, {{service.id}}, and {{service.url}}. That makes shared dashboards easier to reuse across services.
Markdown runbooks with live service links
Compass can render markdown pages next to the service dashboard. I use this for runbooks, architecture notes, and operational docs that should live close to the services they describe.
pages:
  dir: pages
The directory structure becomes the navbar:
pages/
├── architecture.md
└── on-call/
    ├── escalation.md
    └── runbook.md
Pages can include live service cards:
## Monitoring stack

{{< services tag=observability >}}
They can also link to a service with wiki-style syntax:
Check [[grafana]] before paging the application team.
When a page references a service, the service detail page shows a backlink to that page. That makes runbooks discoverable from the service instead of relying on people to know where the documentation lives.
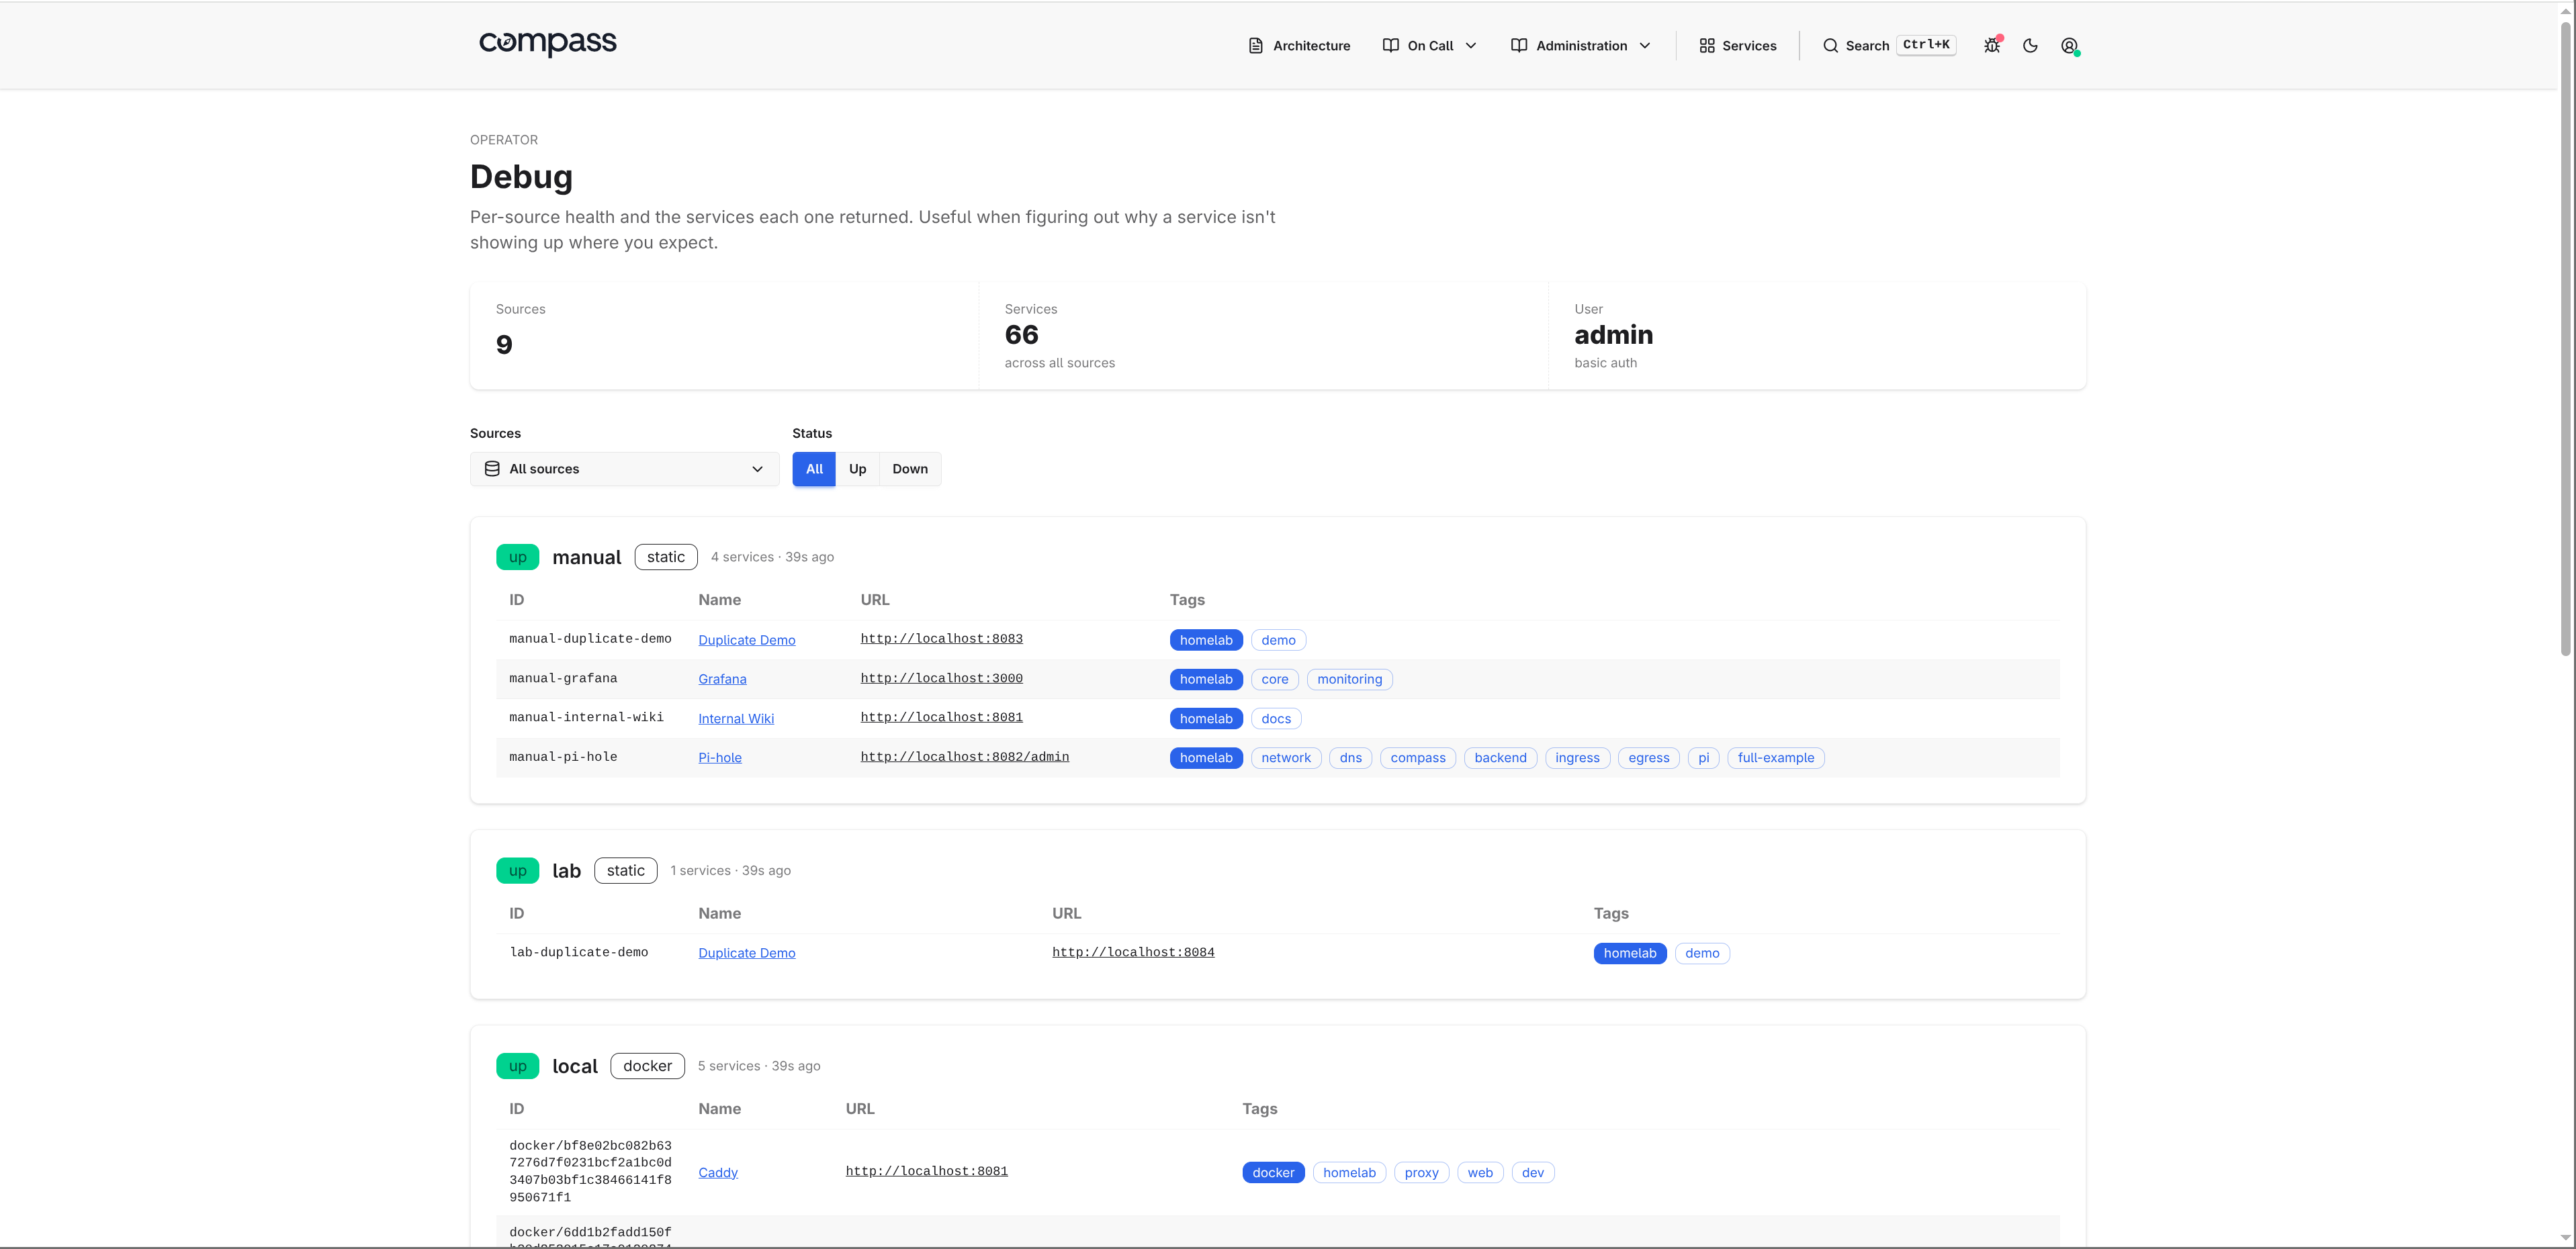
Operations: debug, health, and metrics
Compass has a few operational endpoints that matter once it is deployed.
/debugshows source health, last load time, service count, raw service output, and any source errors./healthis a liveness endpoint for load balancers and orchestrators./metricsexposes Prometheus metrics for HTTP traffic and source refresh status.
The debug page is the first place to check when a service is missing or duplicated.
Compass exports metrics such as:
compass_http_requests_totalcompass_http_request_duration_secondscompass_source_refresh_totalcompass_source_refresh_duration_secondscompass_source_servicescompass_source_last_success_timestamp_seconds
Issues and feedback are welcome in the Compass repository.