
Envoy is a popular open source edge and service proxy that's widely used in modern cloud-native architectures. Envoy gateway is a controller that manages Envoy proxies in a Kubernetes environment. Monitoring Envoy and Envoy gateway is crucial for ensuring the reliability and performance of your applications. In this blog post, we'll explore how to monitor Envoy and Envoy gateway using Prometheus and Grafana and we'll also introduce a new monitoring-mixin for Envoy.
With the retirement of ingress-nginx, many users are looking for alternatives for ingress controllers. Envoy gateway is a great option for those who want to leverage the power of Envoy in their Kubernetes clusters. I recently migrated from ingress-nginx and you can read more about it here.
The mixin can be found on GitHub. The dashboards are the following:
- Envoy Overview - A dashboard that provides an overview of Envoy.
- Envoy Upstream - A dashboard that provides an overview of the Envoy upstreams. It also has multiple filters to dive deeper into specific upstreams.
- Envoy Downstream - A dashboard that provides an overview of the Envoy downstreams. It also has multiple filters to dive deeper into specific downstreams.
- Envoy Gateway Overview - A dashboard that provides an insights to the Envoy Gateway controller. It shows the number of resources managed by the controller and the reconciliation duration alongside XDS updates.
If consuming these through jsonnet then you can easily opt out of the Envoy Gateway monitoring by modifying the config.libsonnet file. You can do so by setting the following configuration:
{
  _config+:: {
    envoyGateway+: {
      enabled: false,
    },
  },
}
Prerequisites
The mixin assumes that you have already figured out how to scrape metrics from Envoy and Envoy Gateway with Prometheus. If you haven't done so, I've written a blog post on my migration from ingress-nginx to Envoy Gateway, which includes instructions on how to set up Prometheus scraping for Envoy and Envoy Gateway. You can read the blog post here.
Grafana Dashboards
Envoy
Envoy Overview
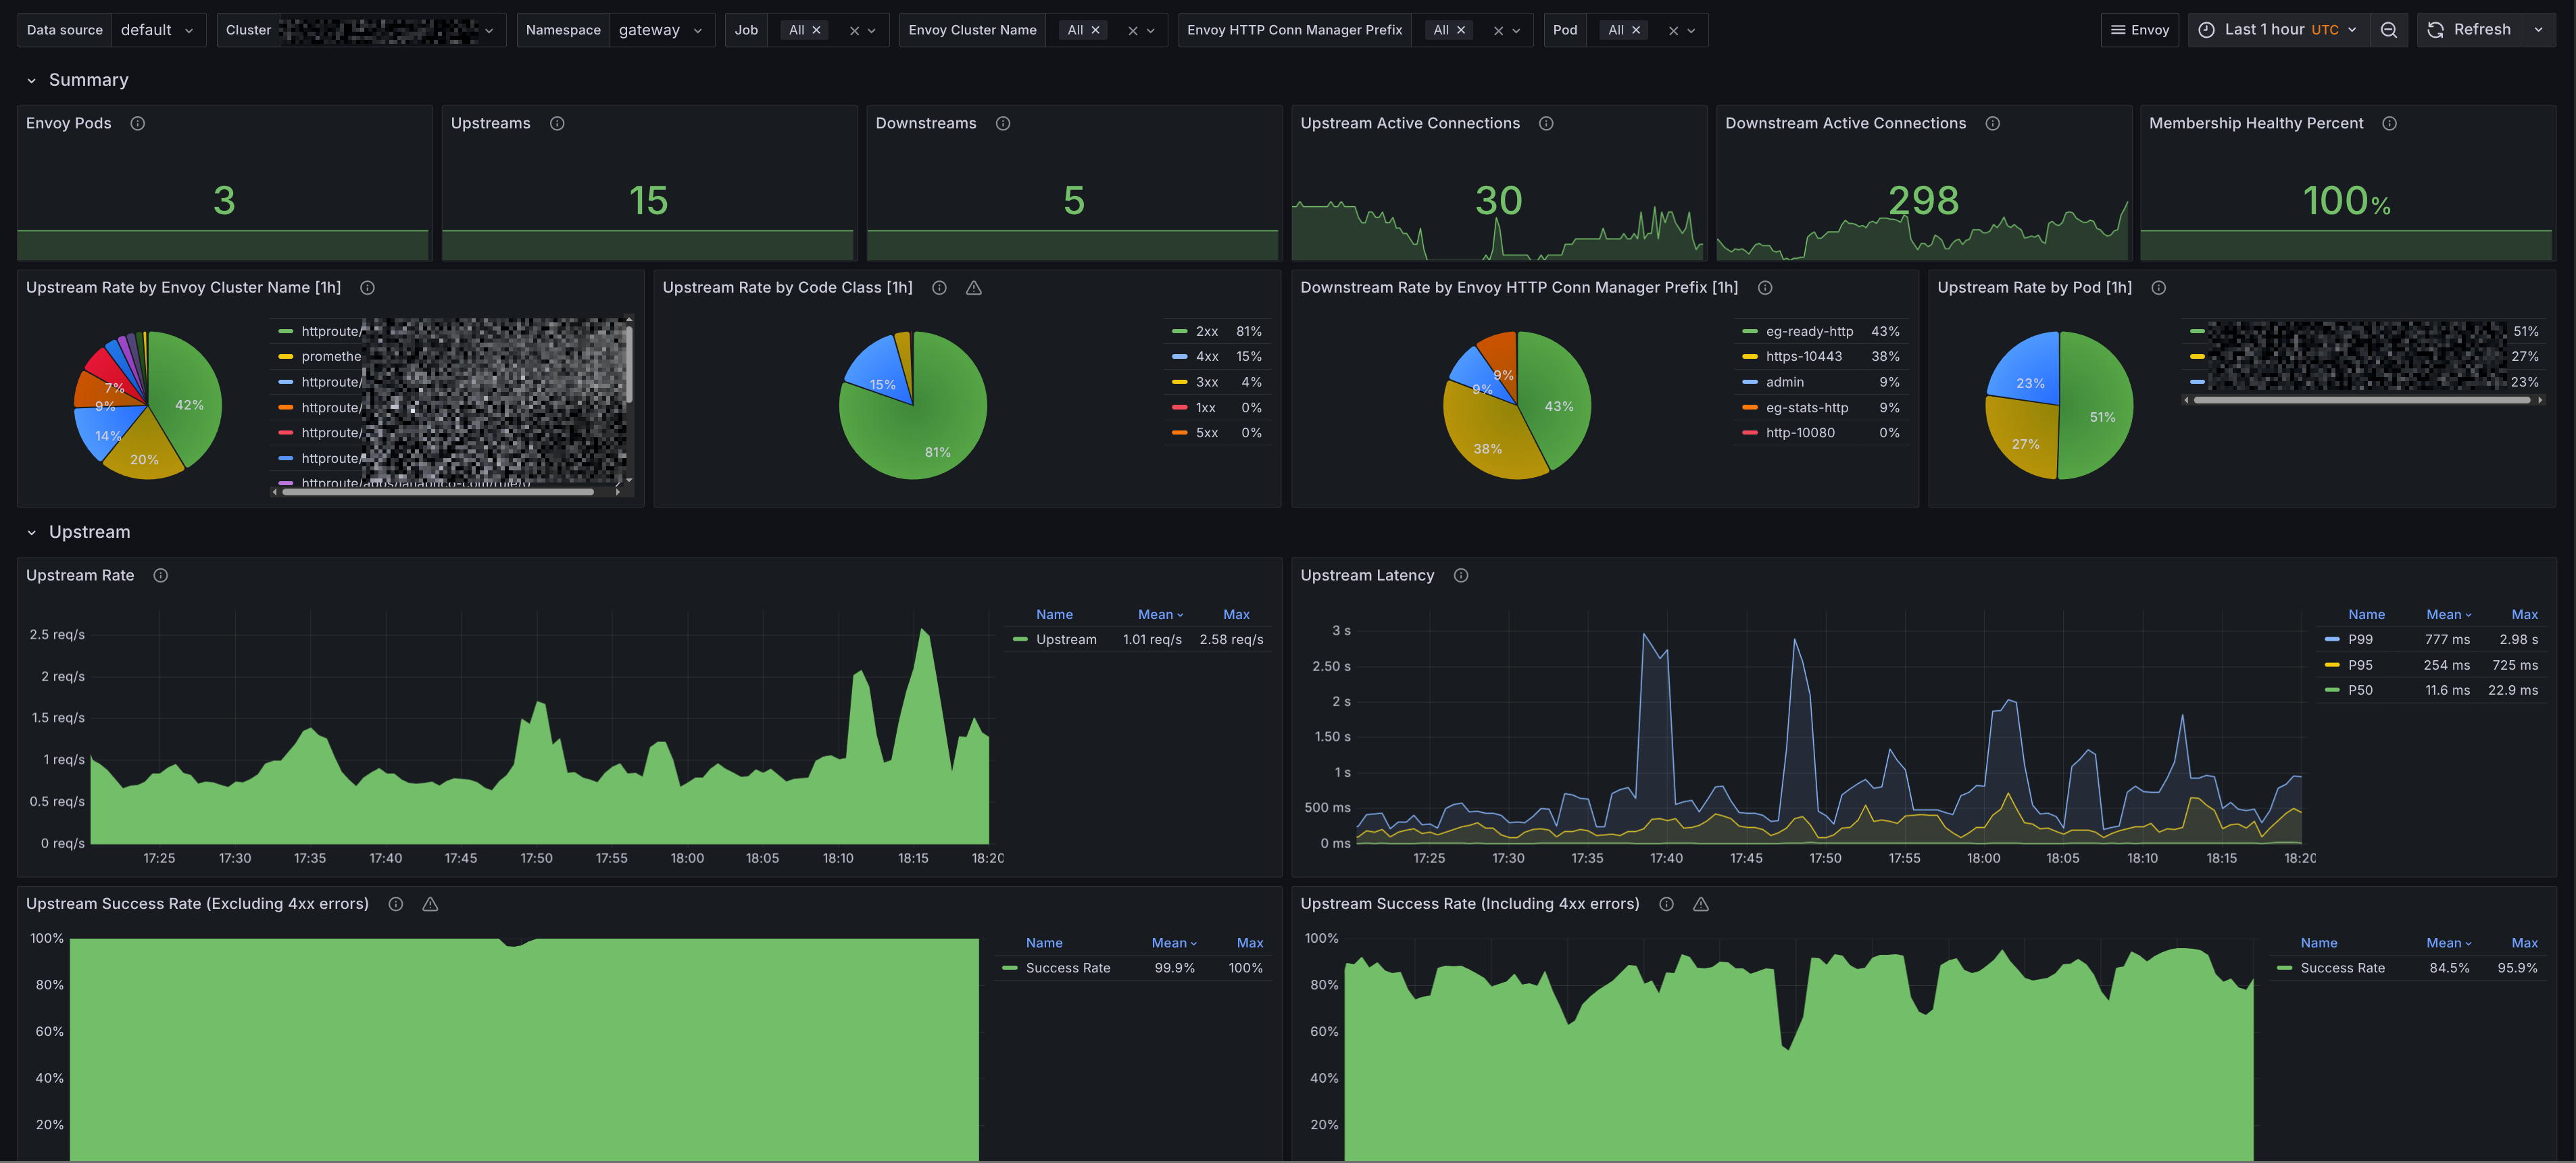
The Grafana dashboard provides an overview of the Envoy in your Kubernetes cluster. It includes the following panels:
- Filters - Allows us to filter by namespace, job, downstream http listener, upstream and pods.
- Summary - Provides an overview of Envoy metrics, including total requests, error rates, and request distribution.
- Upstream Summary - Displays metrics related to upstream clusters, including request counts, error rates, and latency distributions.
- Downstream Summary - Displays metrics related to downstream listeners, including request counts, error rates,
- SSL - Displays metrics related to SSL certificate expiration.
Envoy Upstream
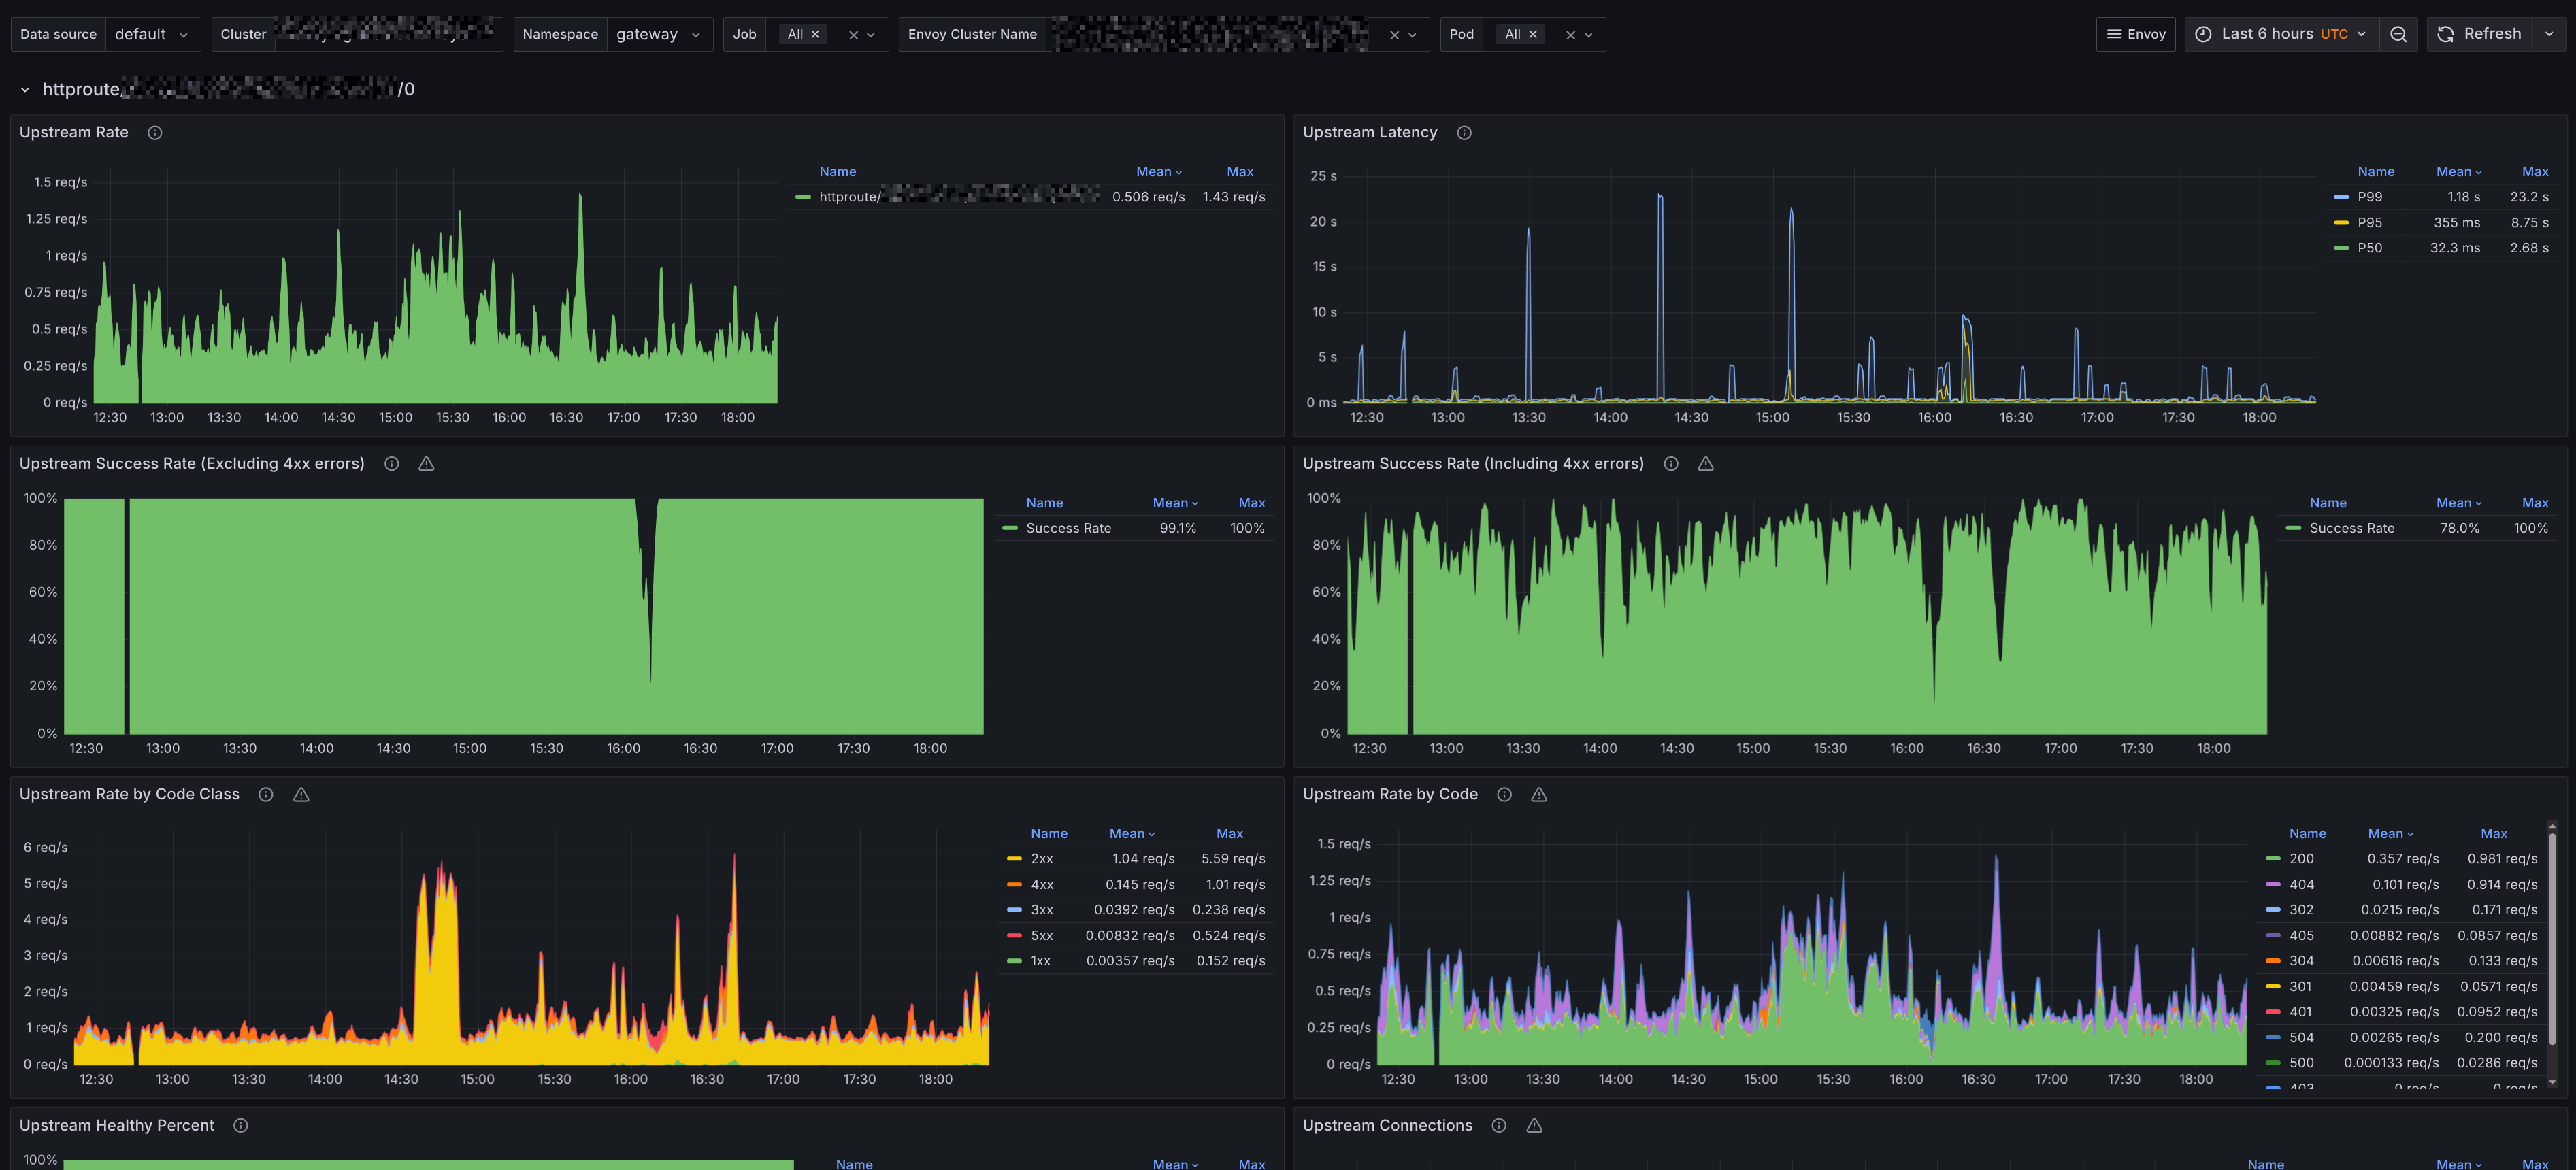
The Grafana dashboard provides an overview of the Envoy upstreams in your Kubernetes cluster. It includes the following panels:
- Summary - Provides an overview of upstream metrics, showing a distrubution of requests by upstream allowing you to see which upstreams are receiving the most traffic and have the most active connections.
- Cluster Breakdown - Displays a breakdown of upstream clusters, showing request counts, error rates, latency distributions, and circuit breakers for each cluster. Use the filters to dive deeper into specific upstreams.
Envoy Downstream
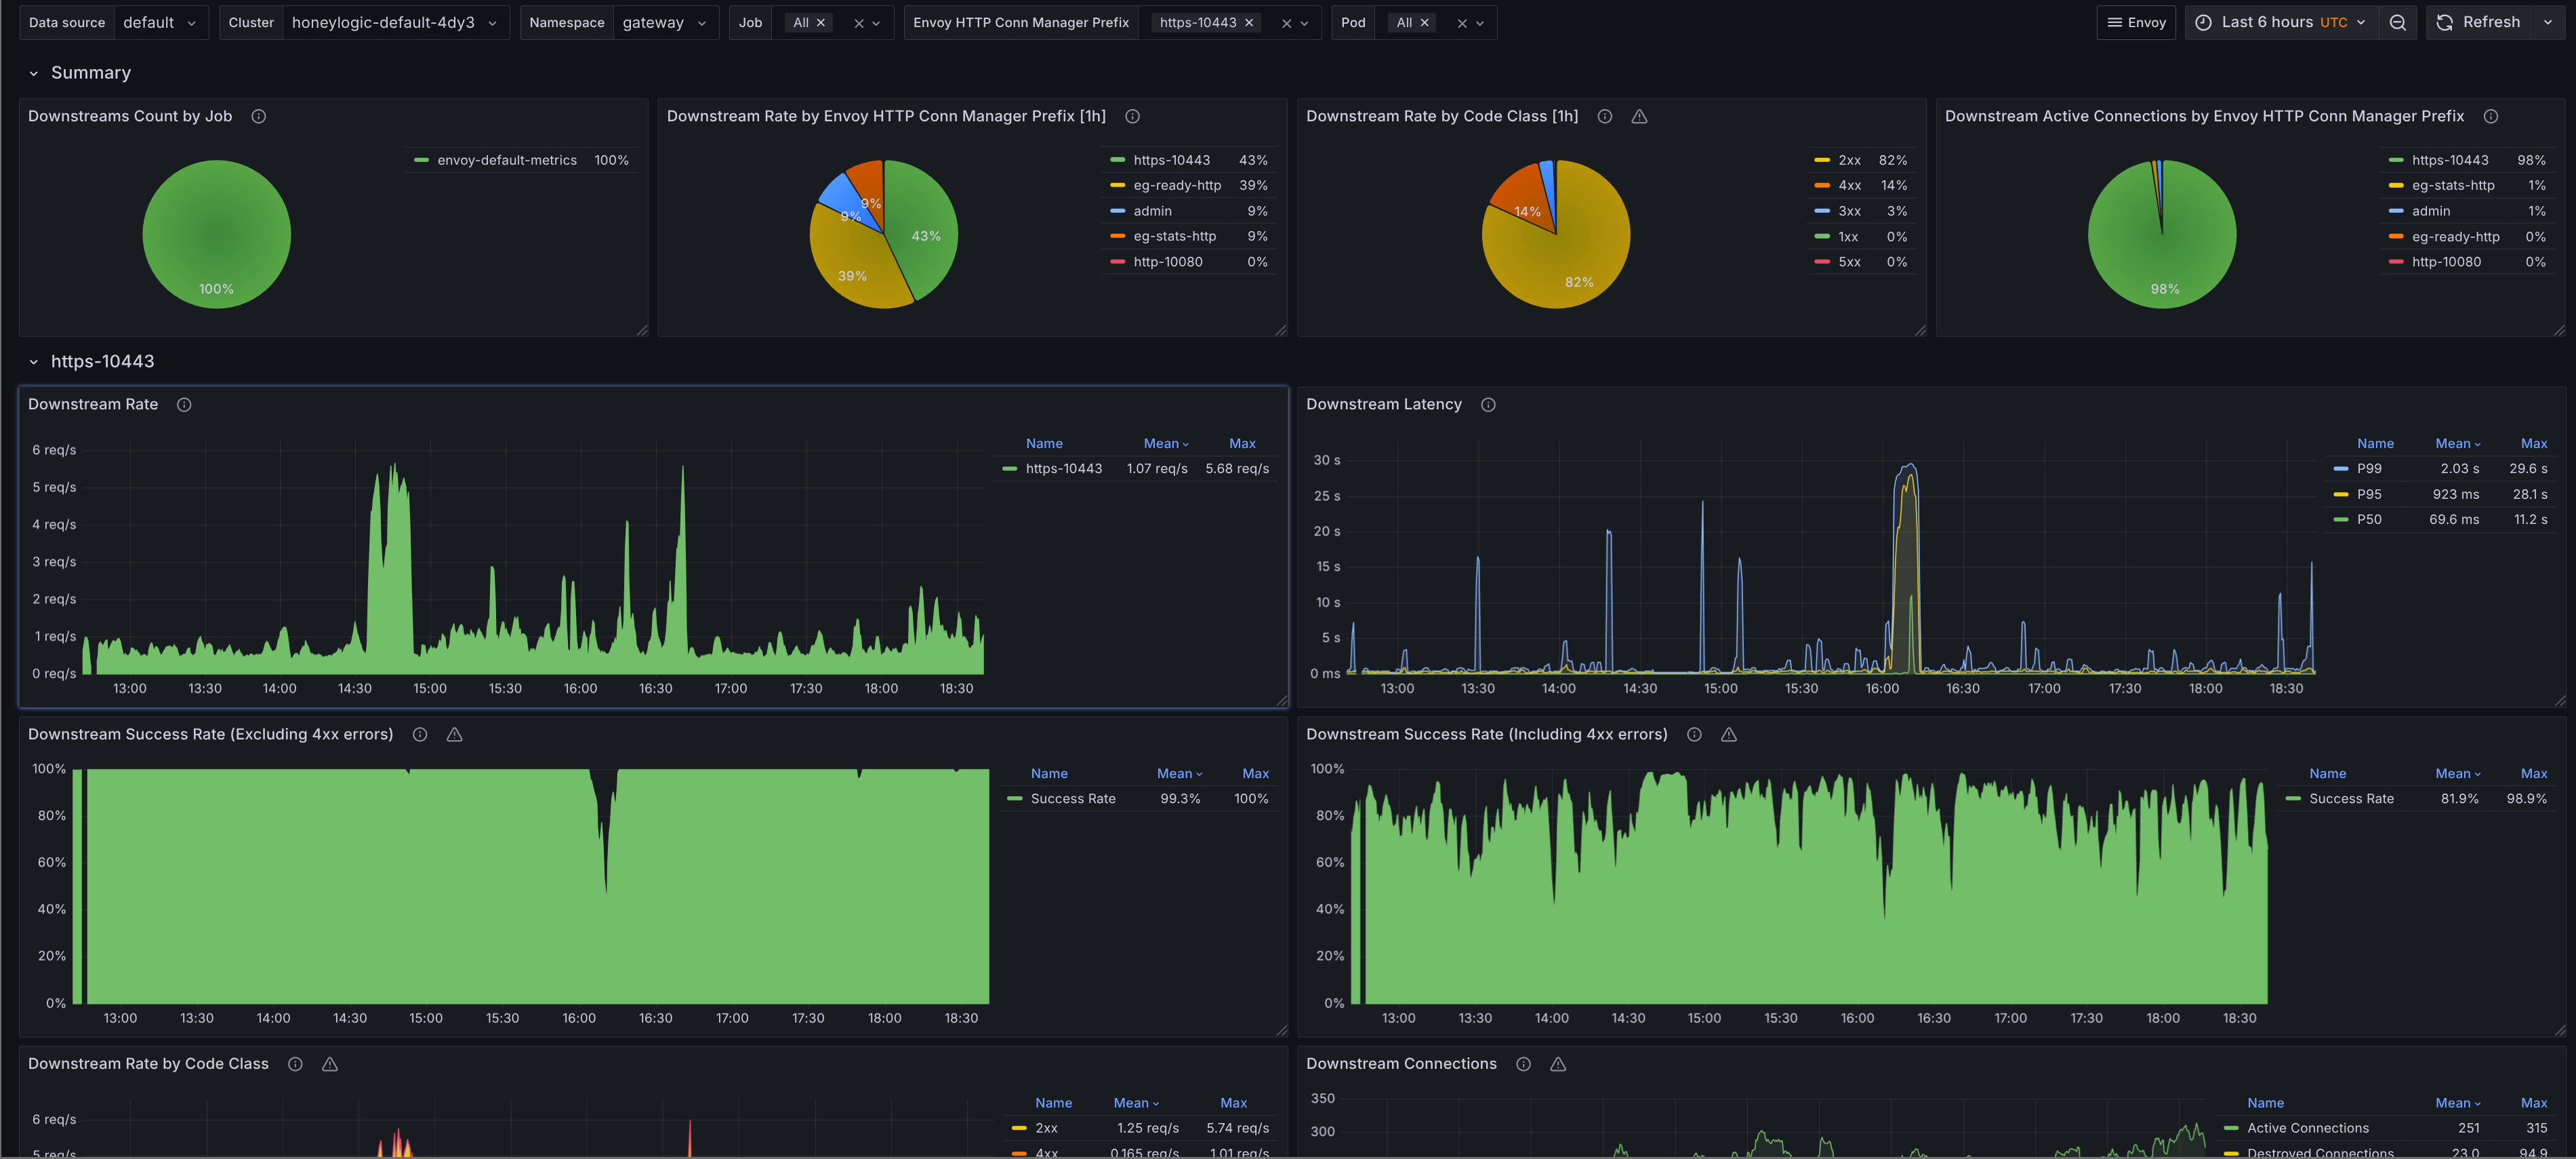
The Grafana dashboard provides an overview of the Envoy downstreams in your Kubernetes cluster. It's similar to the upstream dashboard except that it's for downstreams. It includes the following panels:
- Summary - Provides an overview of downstream metrics, showing a distrubution of requests by downstream allowing you to see which downstreams are receiving the most traffic and have the most active connections.
- Listener Breakdown - Displays a breakdown of downstream listeners, showing request counts, error rates, latency distributions for each listener. Use the filters to dive deeper into specific downstreams.
Envoy Gateway
Envoy Gateway Overview
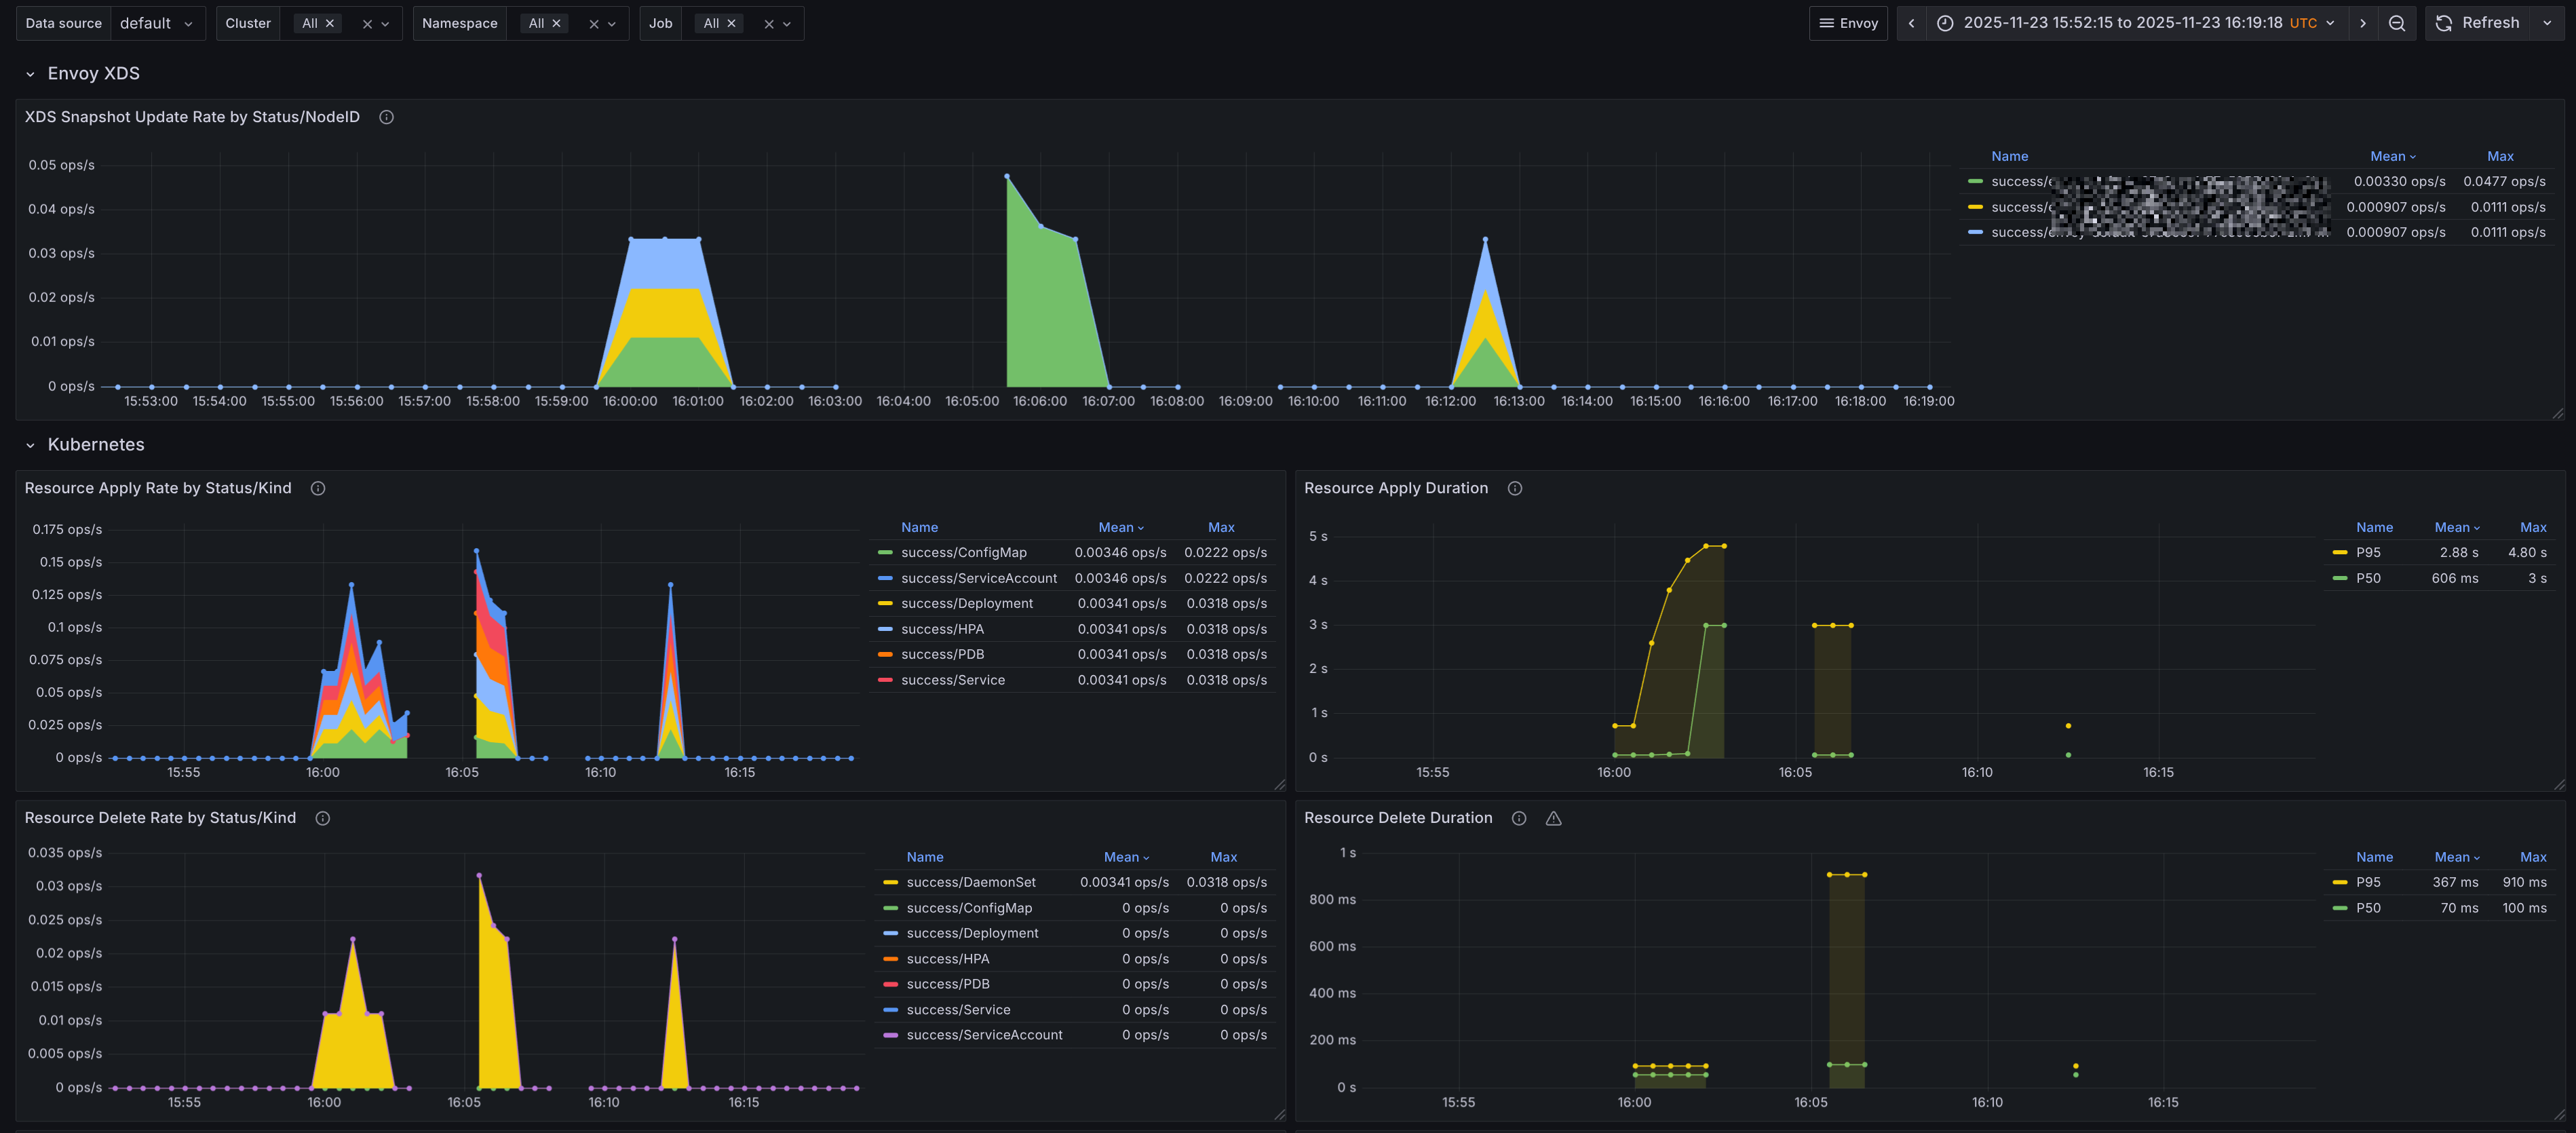
The Grafana dashboard provides an overview of the Envoy Gateway controller in your Kubernetes cluster. It includes the following panels:
- Envoy XDS - Displays metrics related to Envoy XDS updates.
- Kubernetes - Displays controller metrics related to Kubernetes resources managed by the Envoy Gateway controller. The number of updates and count of
Deployments,ServiceAccounts,PDBsetc.
Alerts
Alerts are trickier to get right for a generic use case, however they're still provided by the envoy-mixin. You can configure alerts using the config.libsonnet file in the repository. If you're familiar with Jsonnet, customizing these alerts is straightforward. The alerts can be found on GitHub, and I'll add a description for the alerts below.
Envoy Alerts
- Alert name:
EnvoyUpstreamHighHttp4xxErrorRate
Alerts when the HTTP 4xx error rate for an upstream cluster is elevated over the last 5 minutes. This usually indicates that clients are sending invalid or malformed requests to the upstream service.
- Alert name:
EnvoyUpstreamHighHttp5xxErrorRate
Alerts when the HTTP 5xx error rate for an upstream cluster is elevated over the last 5 minutes. This typically signals that the upstream service is unhealthy or encountering failures.
- Alert name:
EnvoyCircuitBreakerOpen
Alerts when the circuit breaker for an upstream cluster is open. This usually indicates that the upstream service is unhealthy or overloaded and is no longer able to handle incoming requests.
- Alert name:
EnvoyUpstreamConnectionFailures
Alerts when there are connection failures to an upstream cluster. This indicates that the upstream service is unreachable.
- Alert name:
EnvoyUpstreamUnhealthyHosts
Alerts when more than 33% of hosts in an upstream cluster are marked unhealthy. This indicates that the upstream service is experiencing significant issues.
Envoy Gateway Alerts
- Alert name:
EnvoyXDSUpdateFailed
Alerts when there are failed xDS updates in the last 5 minutes. This indicates that the Envoy Gateway controller is having issues managing or updating the Envoy proxies.