
Go applications expose a useful set of runtime metrics, but raw /metrics output does not make it easy to spot GC pressure, scheduler latency, memory growth, or file descriptor exhaustion. This post covers a go-mixin for Prometheus and Grafana that adds a dashboard and alerts for the Go runtime.
The mixin is available on GitHub. It currently ships with one Grafana dashboard and three alert rules:
Go / Overview- A dashboard for runtime CPU usage, scheduler latency, garbage collection, heap churn, mutex contention, cgo activity, and file descriptor pressure.GoHighGcCpu- Alerts when a Go process spends too much CPU time in garbage collection.GoHighSchedulerLatency- Alerts when runnable goroutines wait too long to be scheduled.GoHighFdUsage- Alerts when a Go process is close to its file descriptor limit.
The repo also includes generated dashboard JSON and Prometheus rule files, so you can either vendor the mixin into your Jsonnet setup or import the generated files directly.
Prerequisites
The mixin assumes that your Go processes already expose Prometheus metrics and that Prometheus is scraping them. The dashboard and alerts depend on standard Go and process metrics such as go_info, go_sched_latencies_seconds_bucket, go_gc_pauses_seconds_bucket, process_open_fds, and process_resident_memory_bytes.
If your application already uses prometheus/client_golang and exposes /metrics with promhttp, you likely have most of what you need. In Kubernetes that usually means adding or updating a ServiceMonitor or PodMonitor so Prometheus can scrape the target.
Setup
Clone the repo and install the Jsonnet dependencies:
git clone https://github.com/adinhodovic/go-mixin
cd go-mixin

jb install
Then generate the Prometheus rules and Grafana dashboard:
make prometheus_alerts.yaml
make dashboards_out
Load prometheus_alerts.yaml into Prometheus and import dashboards_out/go-overview.json into Grafana.
If you vendor the mixin into an existing Jsonnet setup, you can override the selectors in config.libsonnet. By default the mixin includes alert targets for node-exporter, kubelet, and kube-apiserver, while the generic all matcher is disabled.
{
  _config+:: {
    alerts+: {
      defaults+: {
        highGcCpu+: {
          threshold: 0.25,
        },

        highSchedulerLatency+: {
          threshold: 0.01,
        },

        highFdUsage+: {
          threshold: 0.80,
        },
      },

      jobs+: {
        all: {
          enabled: false,
        },

        myService: {
          enabled: true,
          matcher: 'job="my-service"',

          highGcCpu+: {
            severity: 'critical',
            threshold: 0.35,
          },

          highSchedulerLatency+: {
            threshold: 0.02,
          },
        },

        kubelet: {
          highGcCpu+: {
            threshold: 0.40,
          },

          highFdUsage+: {
            severity: 'critical',
            threshold: 0.90,
          },
        },
      },
    },
  },
}
This keeps the generic matcher disabled, adds a dedicated job="my-service" target, and shows how to override thresholds and severity per job.
alerts.defaults defines the shared thresholds and severity, and each entry under alerts.jobs can override only the fields you need.
Grafana dashboard
Go / Overview
The dashboard is split into a few sections so it is easier to move from a high-level runtime view to a single pod or instance:
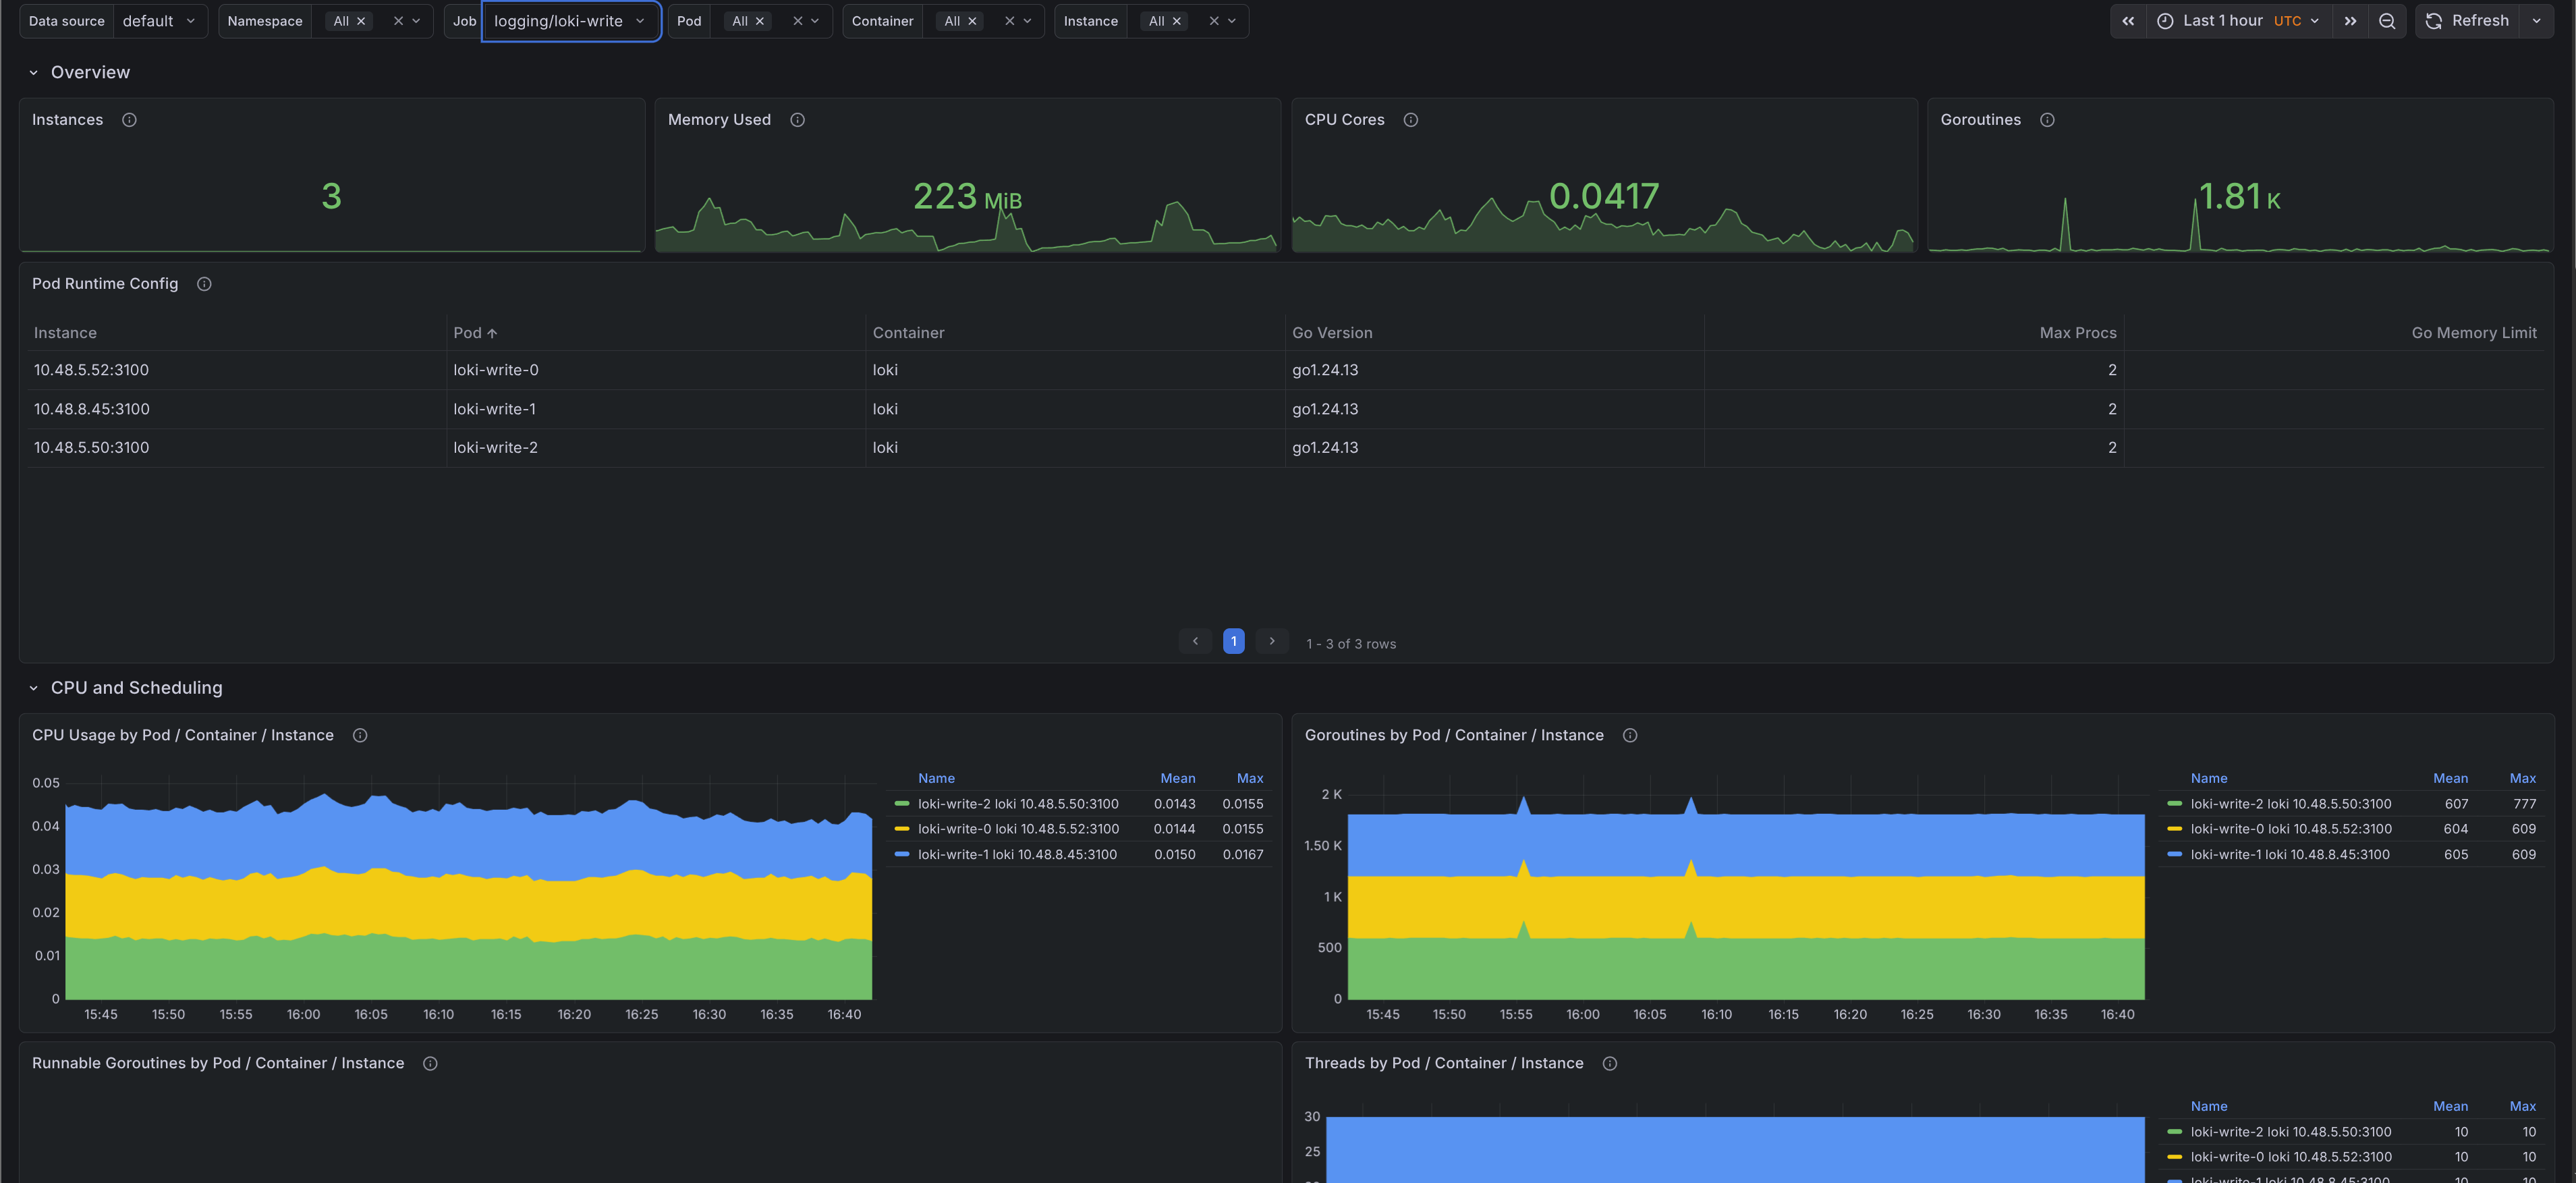
- Filters - Filter by cluster, namespace, job, pod, container, and instance.
- Overview - Shows instance count, memory used, CPU cores, current goroutines, and a runtime configuration table with Go version,
GOMAXPROCS, andGOMEMLIMIT. - CPU and scheduling - Shows CPU usage by target, runnable goroutines, thread count, scheduler latency, and GC CPU ratio.
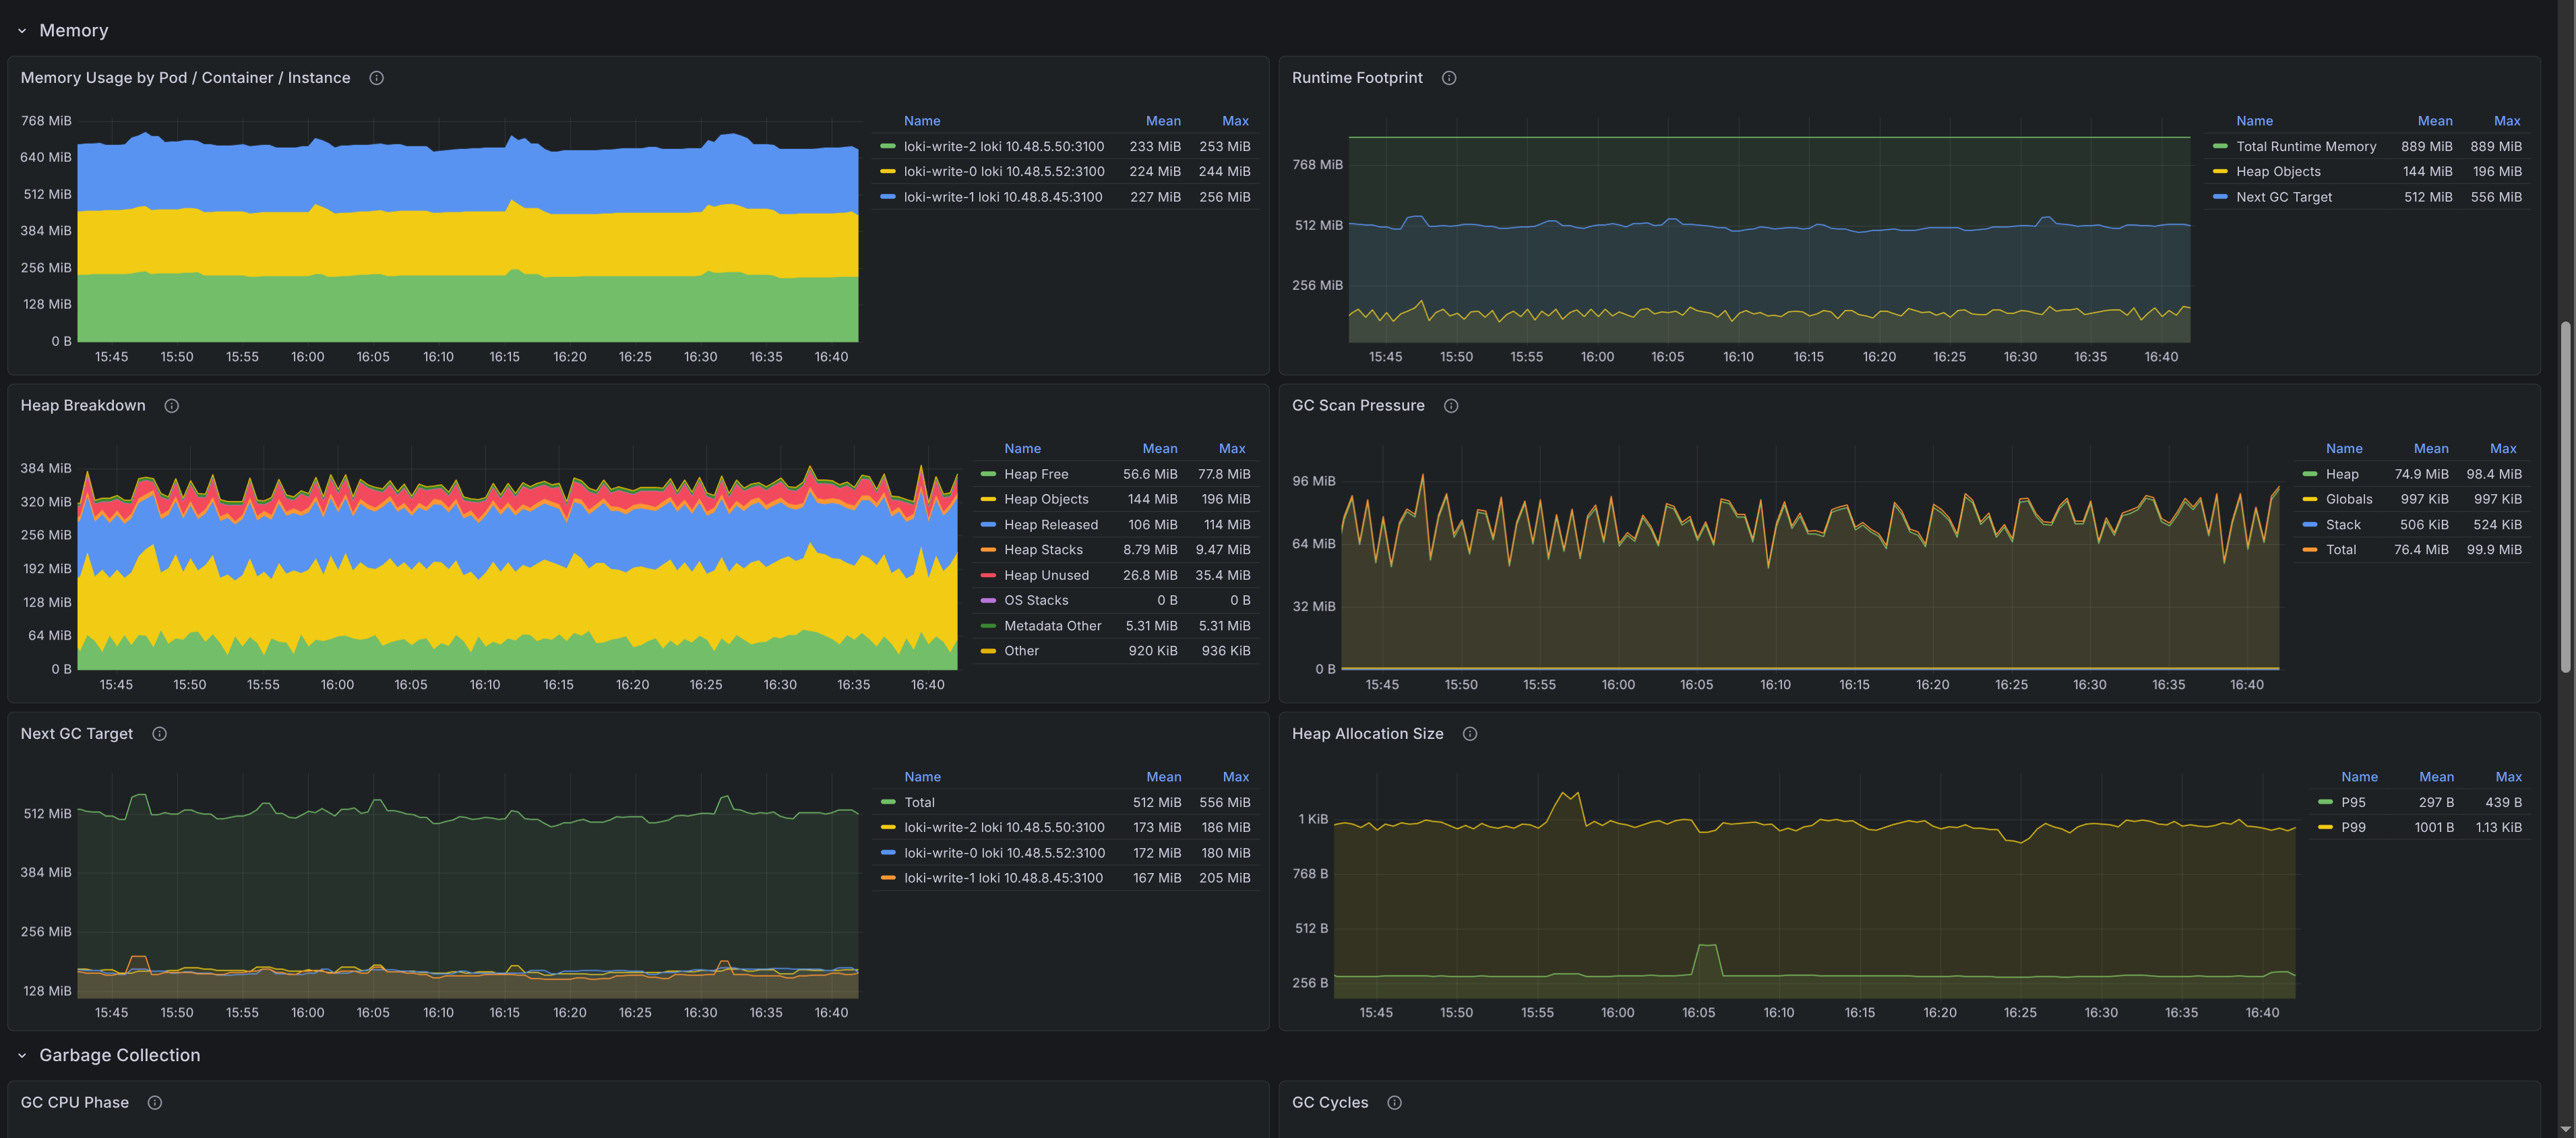
- Memory - Shows resident memory, runtime footprint, heap breakdown, scan pressure, next GC target, and allocation size percentiles.
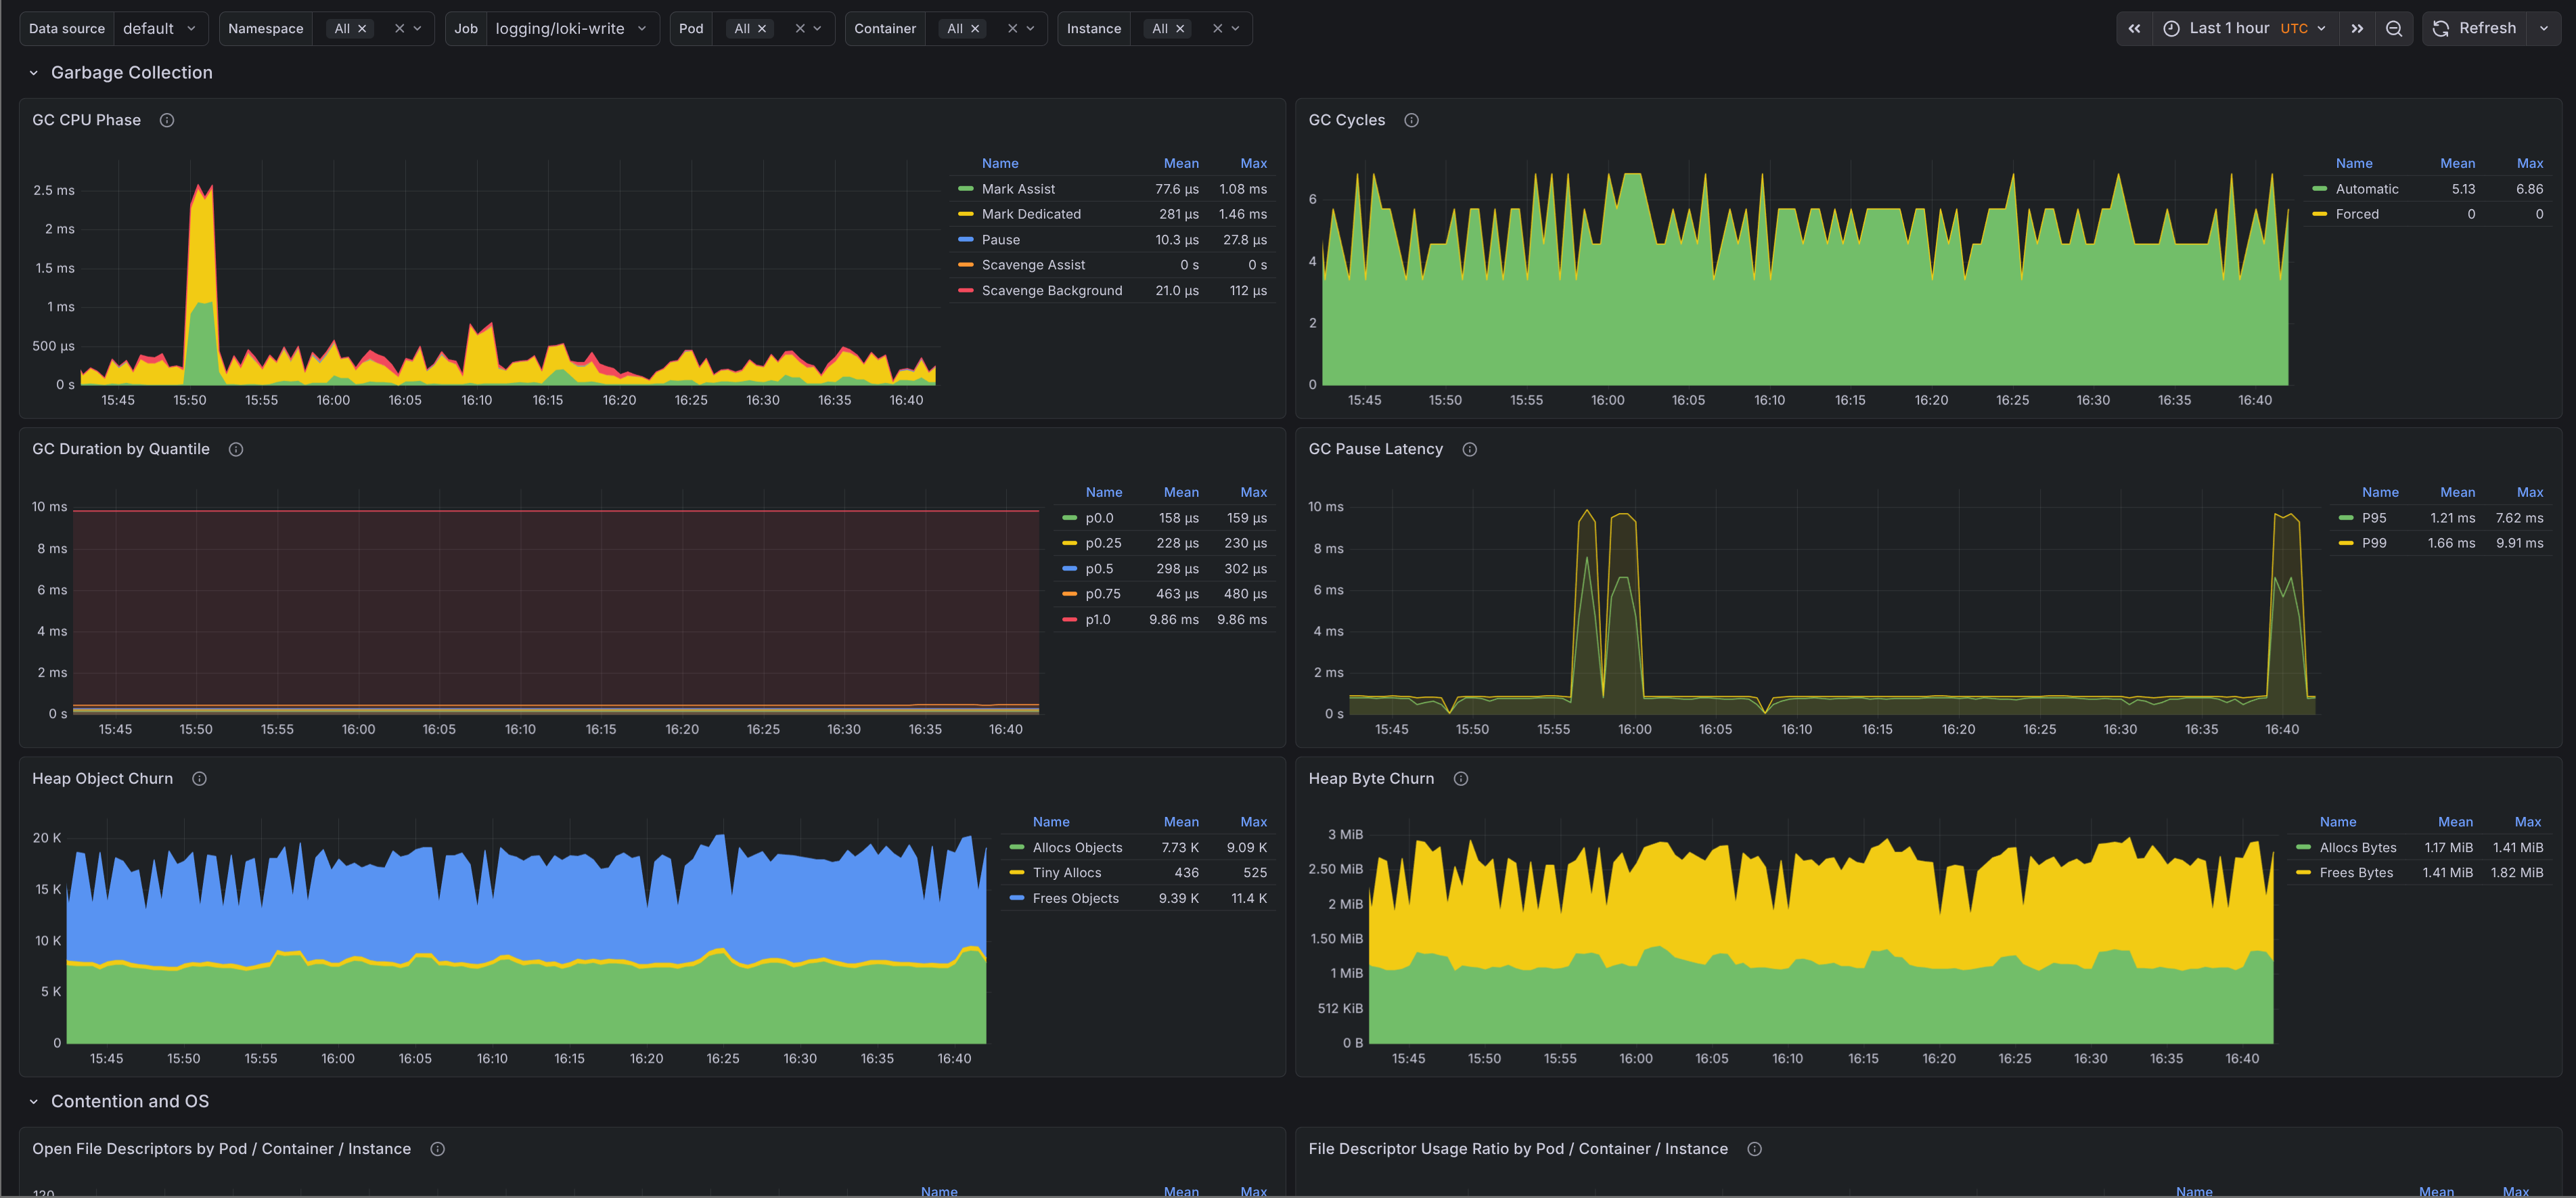
- Garbage collection - Shows GC CPU phases, cycle counts, GC duration quantiles, pause latency, and heap allocation and free churn.
- Contention and OS - Shows open file descriptors, file descriptor usage ratio, mutex wait time, and cgo call rate.
Most runtime dashboards stop at goroutines, heap size, and GC pauses. This one goes a bit deeper into scheduler backlog, scan pressure, allocation size, and mutex wait time, which makes it easier to tell whether a problem is caused by allocation churn, lock contention, or plain CPU pressure.
Alerts
The mixin keeps the alert set small and focused. All three alerts link back to the dashboard with the matching namespace, job, and pod filters.
GoHighGcCpu- Fires when the ratio betweengo_cpu_classes_gc_total_cpu_seconds_totaland total Go runtime CPU stays above the configured threshold. This is useful when a process is still up but spends too much time collecting garbage.GoHighSchedulerLatency- Fires when Go scheduler P99 latency stays above the configured threshold. This usually points to runnable goroutines waiting too long for CPU time.GoHighFdUsage- Fires whenprocess_open_fds / process_max_fdsstays above the configured threshold. This catches descriptor exhaustion before the process starts failing to open sockets or files.
The defaults are conservative: 15m for all three alerts, 25% GC CPU, 0.01 seconds for scheduler P99 latency, and 80% file descriptor usage. Override them per job if you know a workload has different behavior.
Issues and feedback are welcome in the GitHub repository.