Headscale is an open source, self-hosted control server compatible with the Tailscale clients. It lets you run your own Tailnet and have full control over users, nodes, keys, and routing policies without relying on Tailscale’s hosted control plane. This post introduces the tailscale-exporter and shows how to collect Headscale metrics via the Headscale gRPC API, and visualize everything in Grafana using dashboards and alerts bundled in the mixin.
The repository can be found at GitHub. The mixin provides Grafana dashboards and Prometheus alerts.
I also wrote about Visualizing your Tailnet in Grafana previously, which focused on Tailscale’s hosted control plane. That blog post also includes a guide on how to monitor the Tailscaled client. This post extends that work to Headscale, enabling you to monitor your self-hosted Headscale network with the same level of detail.
The exporter currently supports the following Headscale features:
- Node Metrics: status, routes, tags, and lifecycle metadata
- User Metrics: provider, identity, and metadata
- API Keys: creation, expiration, and last seen
- Pre-auth Keys: usage, reusable/single-use, ephemeral/persistent
- Health: database connectivity and general service health
Deploying the Exporter for Headscale
You can run the exporter as a standalone binary, a Docker container, or via Helm. The exporter talks to Headscale over gRPC.
Create a Headscale API Key
Generate an API key in Headscale:
headscale apikey create "tailscale-exporter"
Helm
Install the Helm chart and pass the Headscale settings:
helm repo add adinhodovic https://adinhodovic.github.io/tailscale-exporter
helm repo update
helm install tailscale-exporter adinhodovic/tailscale-exporter \
  --namespace monitoring \
  --set env.HEADSCALE_ADDRESS="headscale.example.com:50443" \
  --set env.HEADSCALE_API_KEY="<your-api-key>" \
  --set env.HEADSCALE_INSECURE="false"
If everything works as expected you should see the exporter running and exposing metrics at http://<exporter-service>:9250/metrics. You should be able to query the metrics in Prometheus.
If you’re using prometheus-operator, you can enable ServiceMonitor in your Helm values to have Prometheus automatically discover the exporter:
serviceMonitor:
  enabled: true
Grafana Dashboards
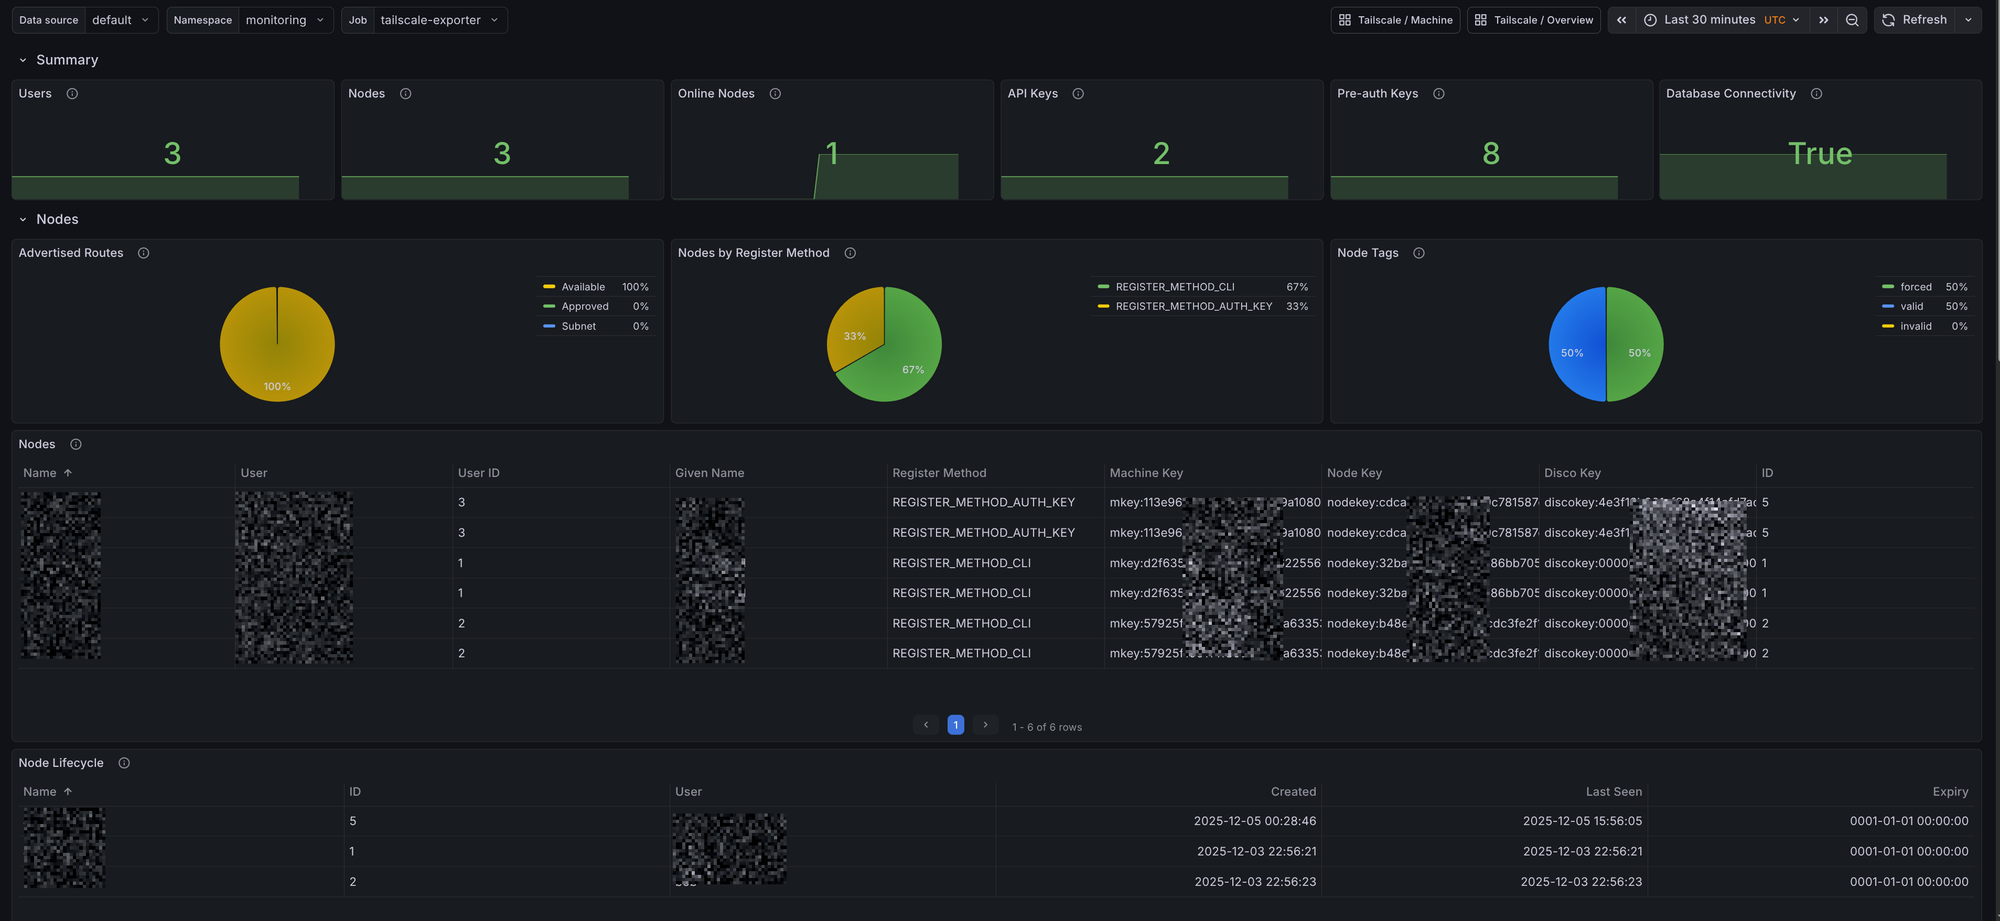
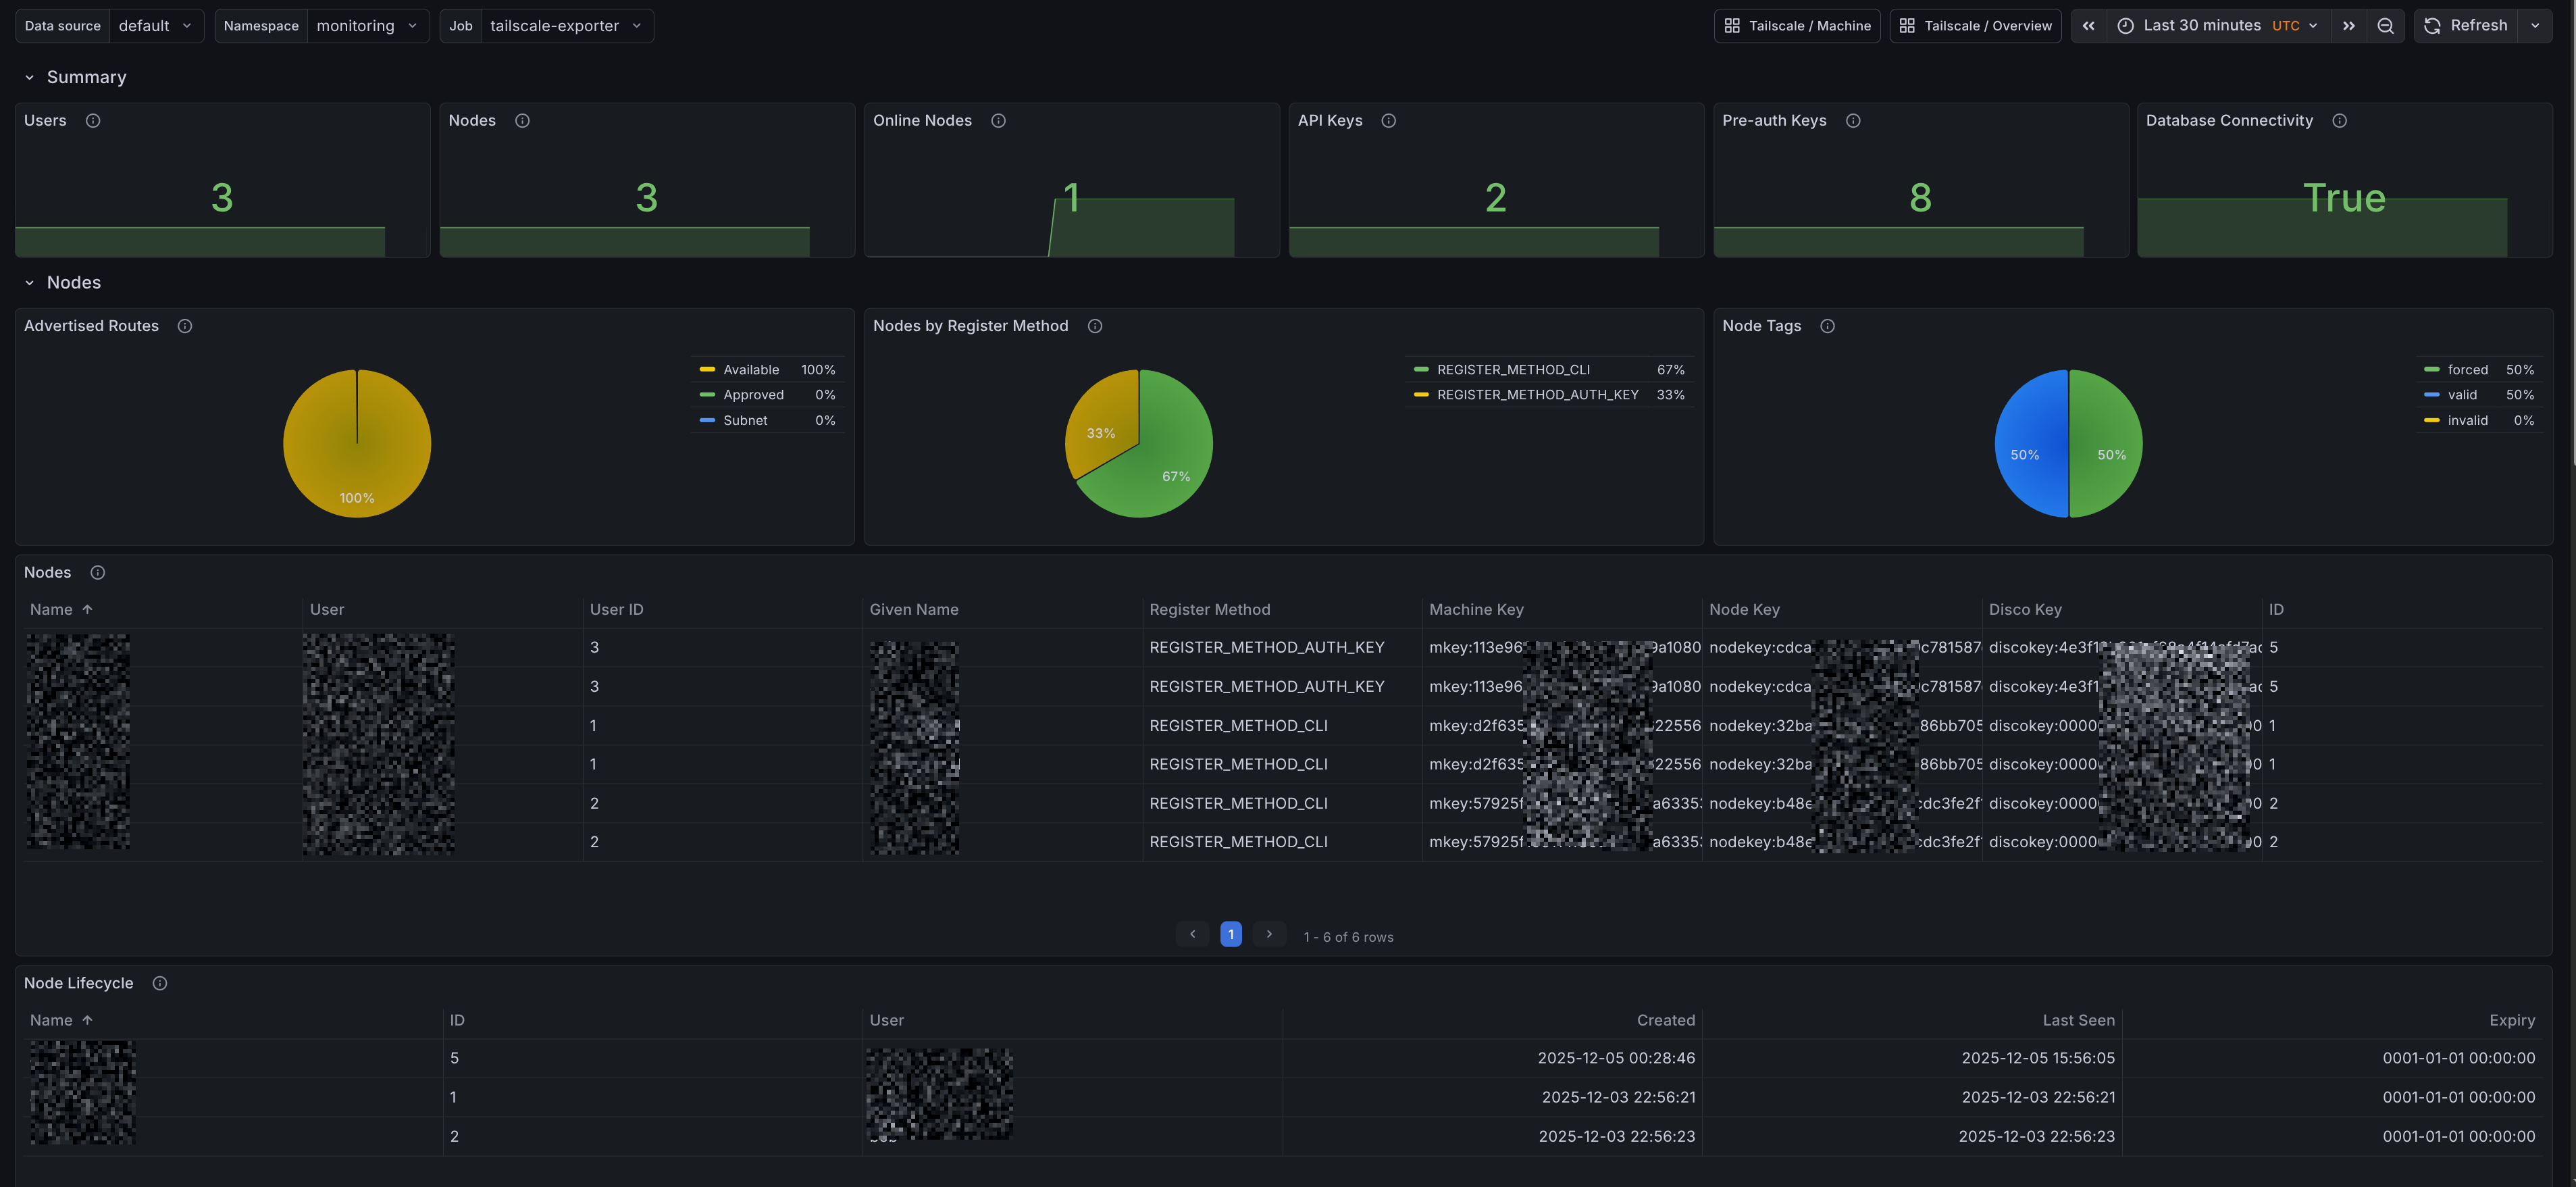
Headscale Overview
The dashboard includes panels for:
-
Summary
- Users: Total number of users known to Headscale
- Nodes: Total nodes discovered by the exporter
- Online Nodes: Nodes currently online
- API Keys: Count of Headscale API keys
- Pre-auth Keys: Count of pre-authentication keys
- Database Connectivity: Headscale database connectivity state
-
Nodes
- Advertised Routes: Approved, Available, and Subnet route distribution
- Nodes by Register Method: Registration method distribution
- Node Tags: Breakdown grouped by category
- Nodes: Table with node metadata (name, user, IDs, keys, register method)
-
Users
- Users by Provider: Identity provider distribution
- Users: Table with user metadata (name, display name, email, provider)
-
Access Management
- Pre-auth Keys: Created, Used, Reusable, and Ephemeral
- API Keys: Created, Expires, and Last Seen
Prometheus Alerts
Alerts are provided by the mixin and are configurable. Headscale alert definitions are present in prometheus_alerts.yaml.
-
Alert name:
HeadscaleDatabaseDown- Triggers when Headscale reports lost database connectivity for longer than 5 minutes.
-
Alert name:
HeadscaleNodeUnapprovedRoutes- Triggers when a Headscale node has more than 10% unapproved routes for longer than 15 minutes.