Syncthing is a popular open-source file synchronization tool that allows users to securely sync files across multiple devices. Monitoring Syncthing is important to ensure that your files are being synchronized correctly and to identify any potential issues. In this guide, we'll explore how to monitor Syncthing using Prometheus and Grafana.
This blog introduces the syncthing-mixin - a collection of pre-configured Grafana dashboards and Prometheus alerts for monitoring Syncthing instances. The mixin simplifies the process of setting up monitoring for Syncthing by providing ready-to-use configurations that can be easily integrated into your existing Prometheus and Grafana setup.
The dashboard is also uploaded to Grafana Dashboards for easy access and installation.
Scraping Syncthing Metrics
To monitor Syncthing, we need to scrape its metrics using Prometheus. Syncthing exposes metrics on the port 8384 by default. You can configure Prometheus to scrape these metrics by adding a scrape_config to your Prometheus configuration file. We'll use the prometheus-operator's ServiceMonitor resource to achieve this. Below is an example:
apiVersion: monitoring.coreos.com/v1
kind: ServiceMonitor
metadata:
  annotations:
  labels:
    app.kubernetes.io/instance: syncthing
    app.kubernetes.io/name: syncthing
    app.kubernetes.io/version: 2.0.10
  name: syncthing
  namespace: utils
spec:
  endpoints:
  - authorization:
      credentials:
        key: apiKey
        name: syncthing
      type: bearer
    interval: 30s
    path: /metrics
    port: http
  namespaceSelector:
    matchNames:
    - utils
  selector:
    matchLabels:
      app.kubernetes.io/instance: syncthing
      app.kubernetes.io/name: syncthing
Note: The above configuration assumes that you have a Kubernetes Service exposing Syncthing with the appropriate labels. Syncthing in this case runs behind authentication, therefore you need to provide an API key for Prometheus to access the metrics endpoint. The API key is stored in a Kubernetes Secret named syncthing under the key apiKey.
Grafana Dashboards
Syncthing Overview
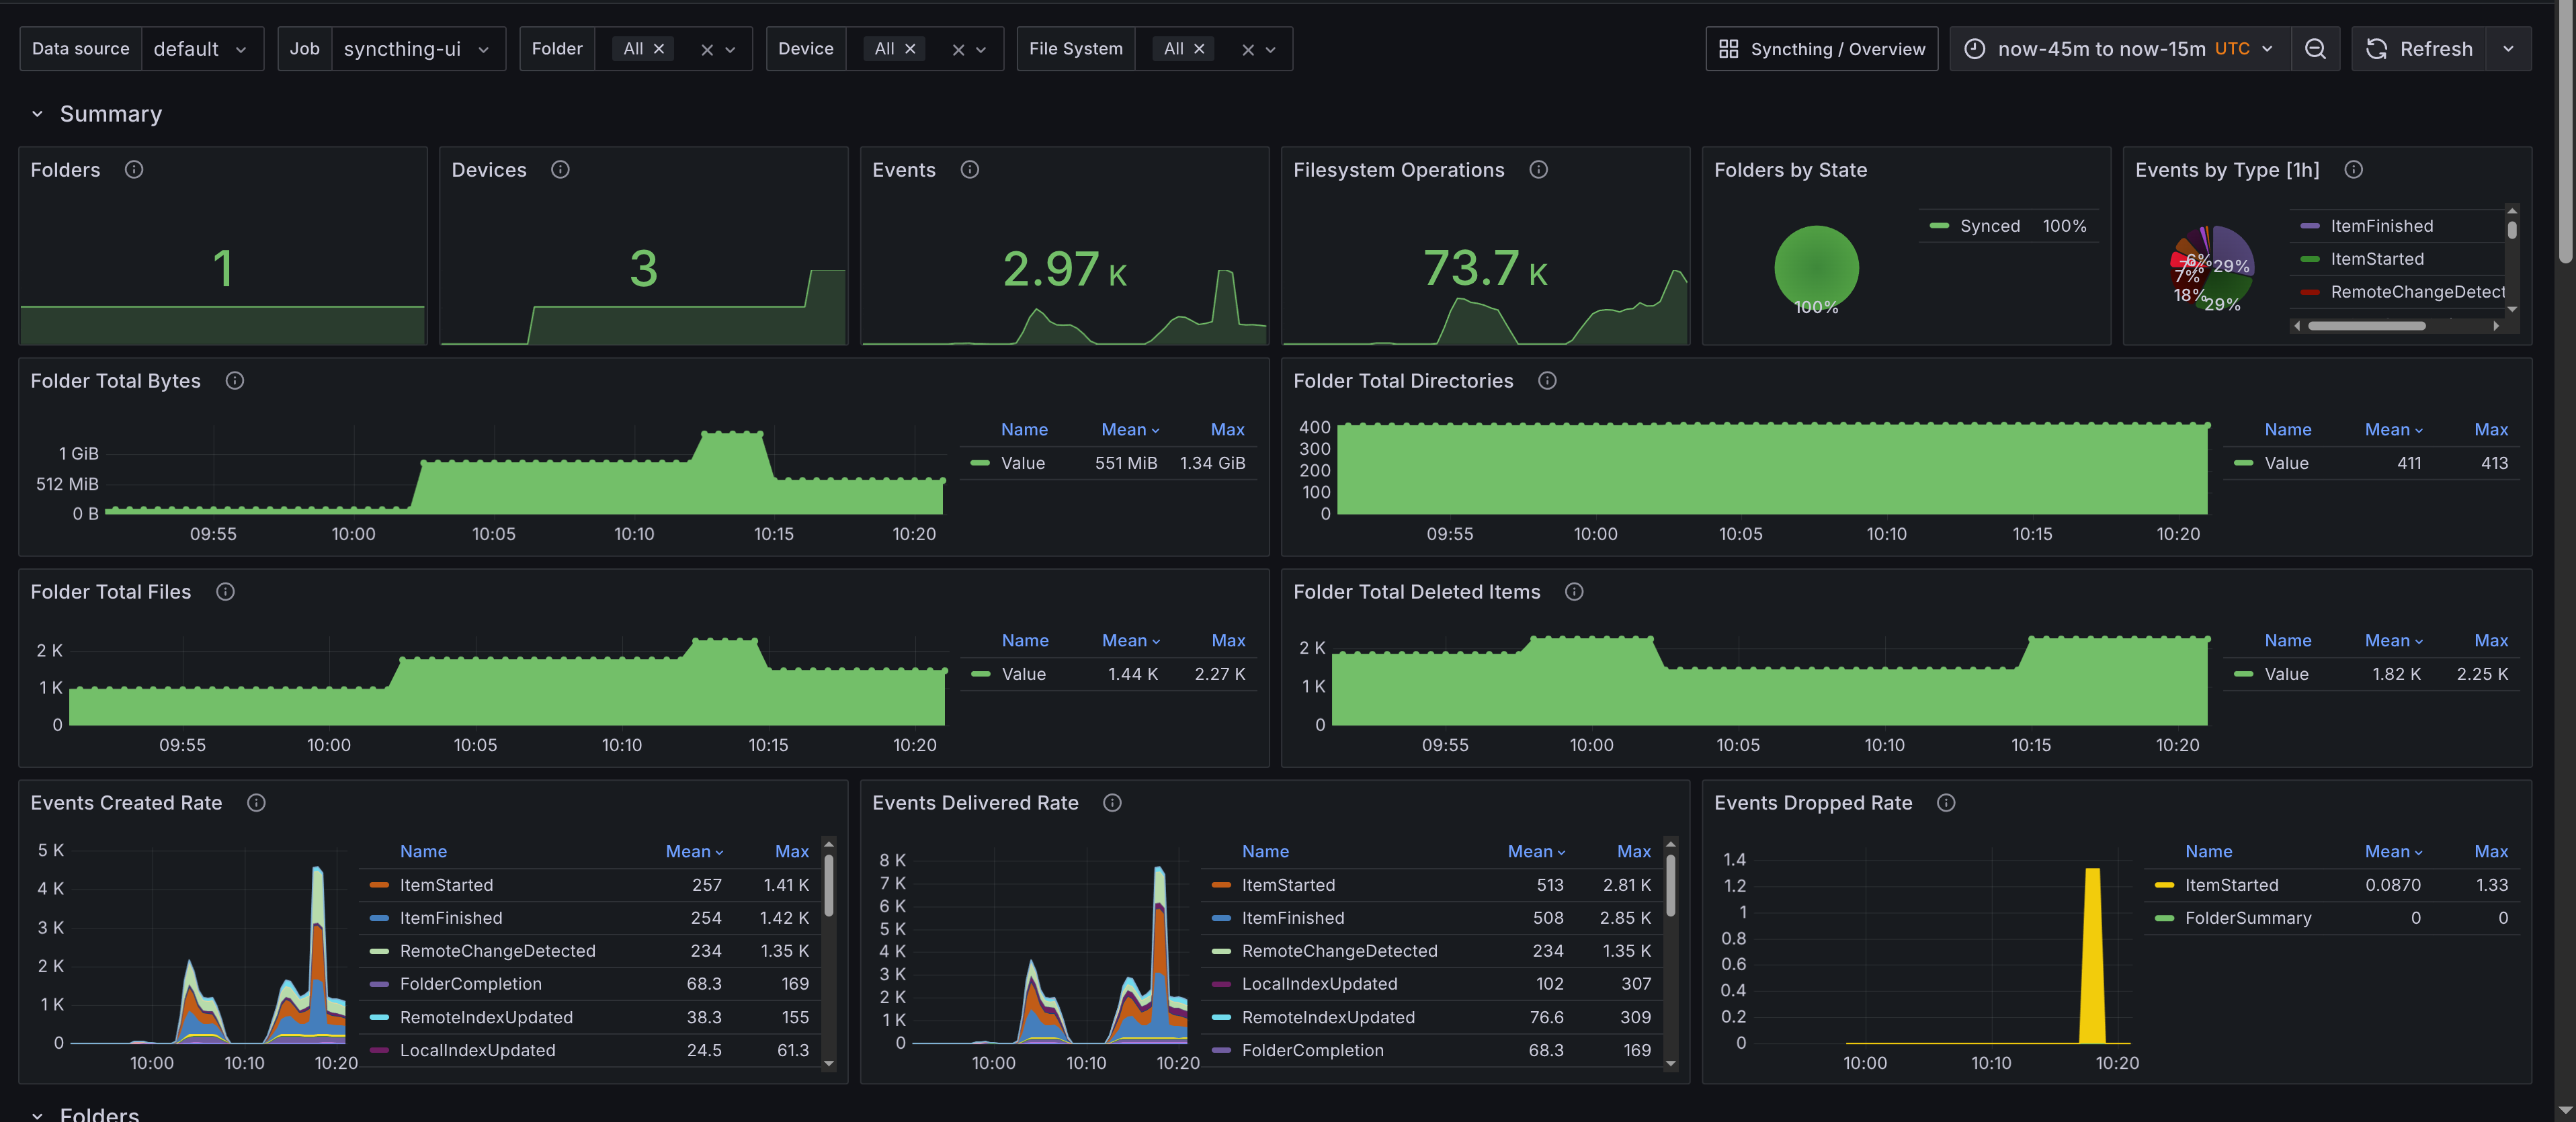
The Grafana dashboard for Syncthing Overview provides a comprehensive view of your Syncthing instances. It includes panels that display:
- Summary - Provides an overview of the Syncthing instances, including the total number of devices, folders, and overall synchronization status.
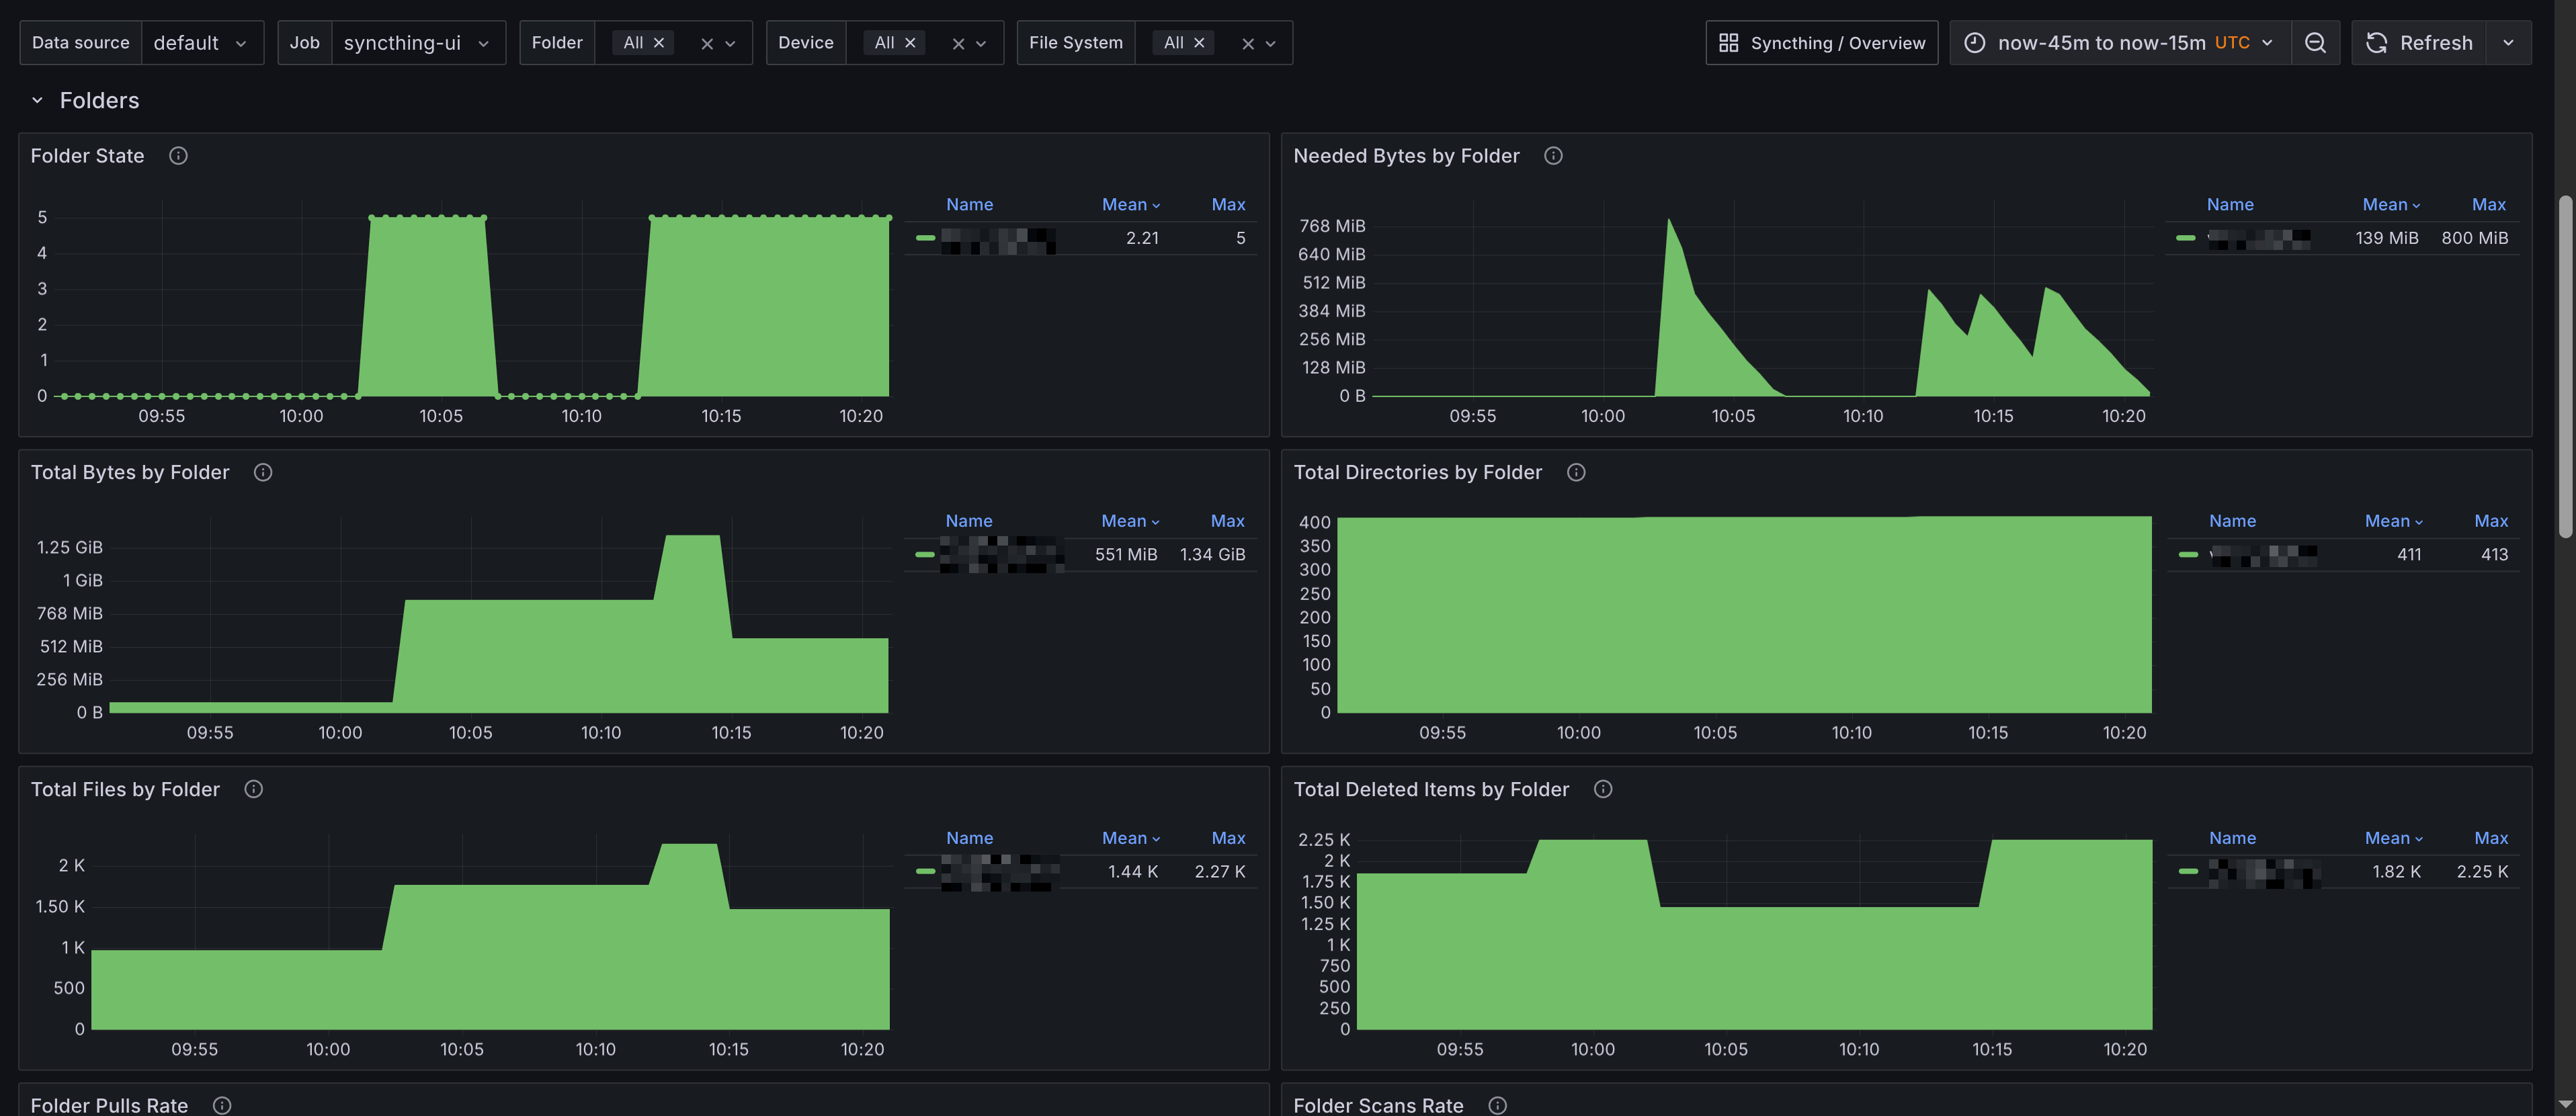
- Folders - Displays the status of folders being synchronized, including the number of files, total size, scans, and synchronization progress.
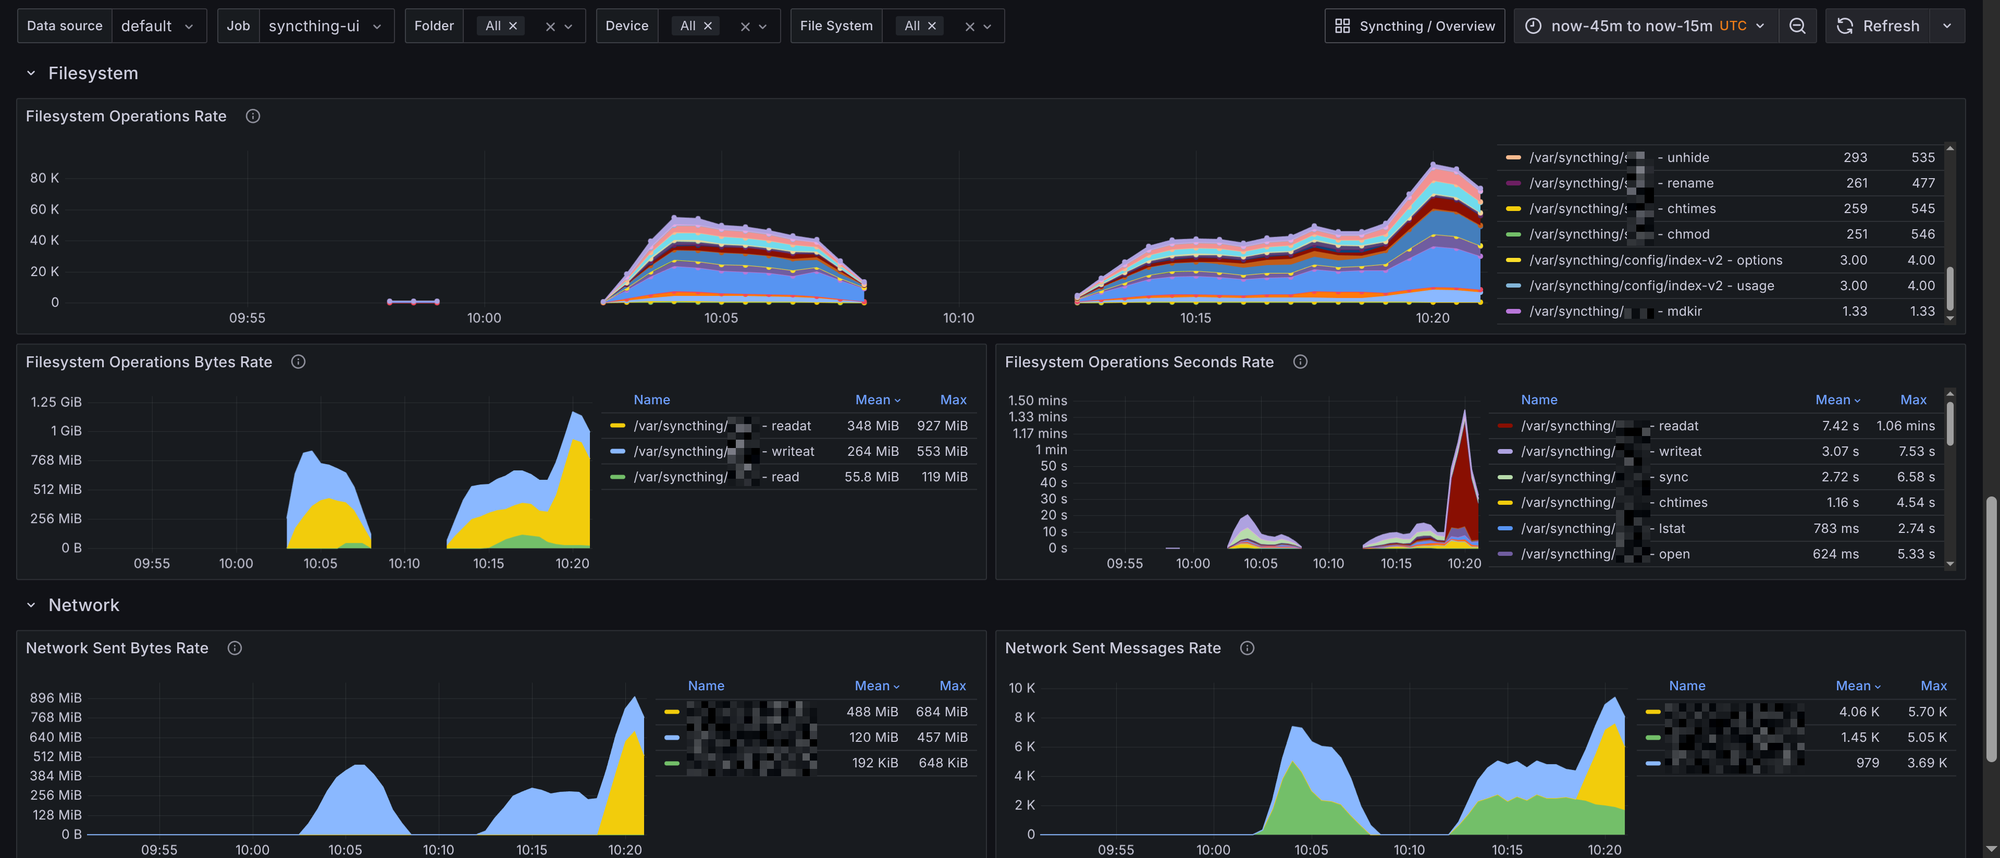
- File System Operations - Shows the number of file system operations, such as file additions, deletions, and modifications.
- Network - Displays network-related metrics, including bytes sent/received per devices.

Prometheus Alerts
Alerts are trickier to get right for a generic use case, and they might be overkill for your usecase. They're also configurable with the config.libsonnet package in the repository, if you are familiar with Jsonnet then customizing the alerts should be fairly straight forward. Alerts are available on GitHub, and I'll add a description for the alerts below.
Syncthing Alerts
- Alert name:
SyncthingEventsDropped
Alerts when Syncthing events are being dropped. This could indicate that the Syncthing instance is under heavy load or experiencing issues.
- Alert name:
SyncthingFolderOutOfSync
Alerts when a Syncthing folder is out of sync. This indicates that the folder is not synchronized across all devices. The threshold is 1h, meaning that it is taking more than 1 hour for the folder to synchronize.