Vault is usually on the critical path for database credentials, PKI, application secrets, and service authentication. If Vault is sealed, has no active node, or starts returning 5xx responses, applications can fail in ways that are hard to debug from the application side. This post covers scraping Vault metrics with Prometheus and monitoring them with Grafana using the vault-mixin.
The mixin can be found on GitHub. It contains one Grafana dashboard and a set of Prometheus alerts:
- Vault Overview - A dashboard that provides an overview of Vault health, request rates, Raft state, tokens, audit logs, and Go runtime metrics.
Issues and feedback are welcome in the GitHub repository.
Prerequisites
The mixin assumes that Prometheus is scraping Vault's metrics endpoint. Vault exposes Prometheus metrics on /v1/sys/metrics?format=prometheus on the API port, which is 8200 by default.
Enable unauthenticated metrics access in the Vault config so Prometheus can scrape the endpoint:
telemetry {
  unauthenticated_metrics_access = true
}
If you're using the prometheus-operator, a ServiceMonitor can look like this:
apiVersion: monitoring.coreos.com/v1
kind: ServiceMonitor
metadata:
  name: vault
  namespace: vault
  labels:
    app.kubernetes.io/name: vault
spec:
  selector:
    matchLabels:
      app.kubernetes.io/name: vault
  endpoints:
    - port: http
      path: /v1/sys/metrics
      params:
        format: ["prometheus"]
      scheme: http
      interval: 30s
      scrapeTimeout: 10s
      metricRelabelings:
        - sourceLabels: [cluster]
          targetLabel: exported_cluster
          action: replace
        - regex: ^cluster$
          action: labeldrop
The relabeling is useful in multi-cluster Prometheus setups. Vault emits a cluster label set to its internal cluster_name. If Prometheus also injects an external cluster label, the labels collide. The example above keeps Vault's internal value as exported_cluster.
Some panels require Vault telemetry gauges that are only emitted when the related Vault features are configured. Token breakdown panels require token usage gauge collection, and audit panels require Vault audit telemetry metrics.
Grafana dashboards
Vault Overview
The Grafana dashboard provides an overview of Vault. It includes the following rows:
- Filters - Allows us to filter by cluster, namespace, job, Vault cluster, Vault namespace, and instance.
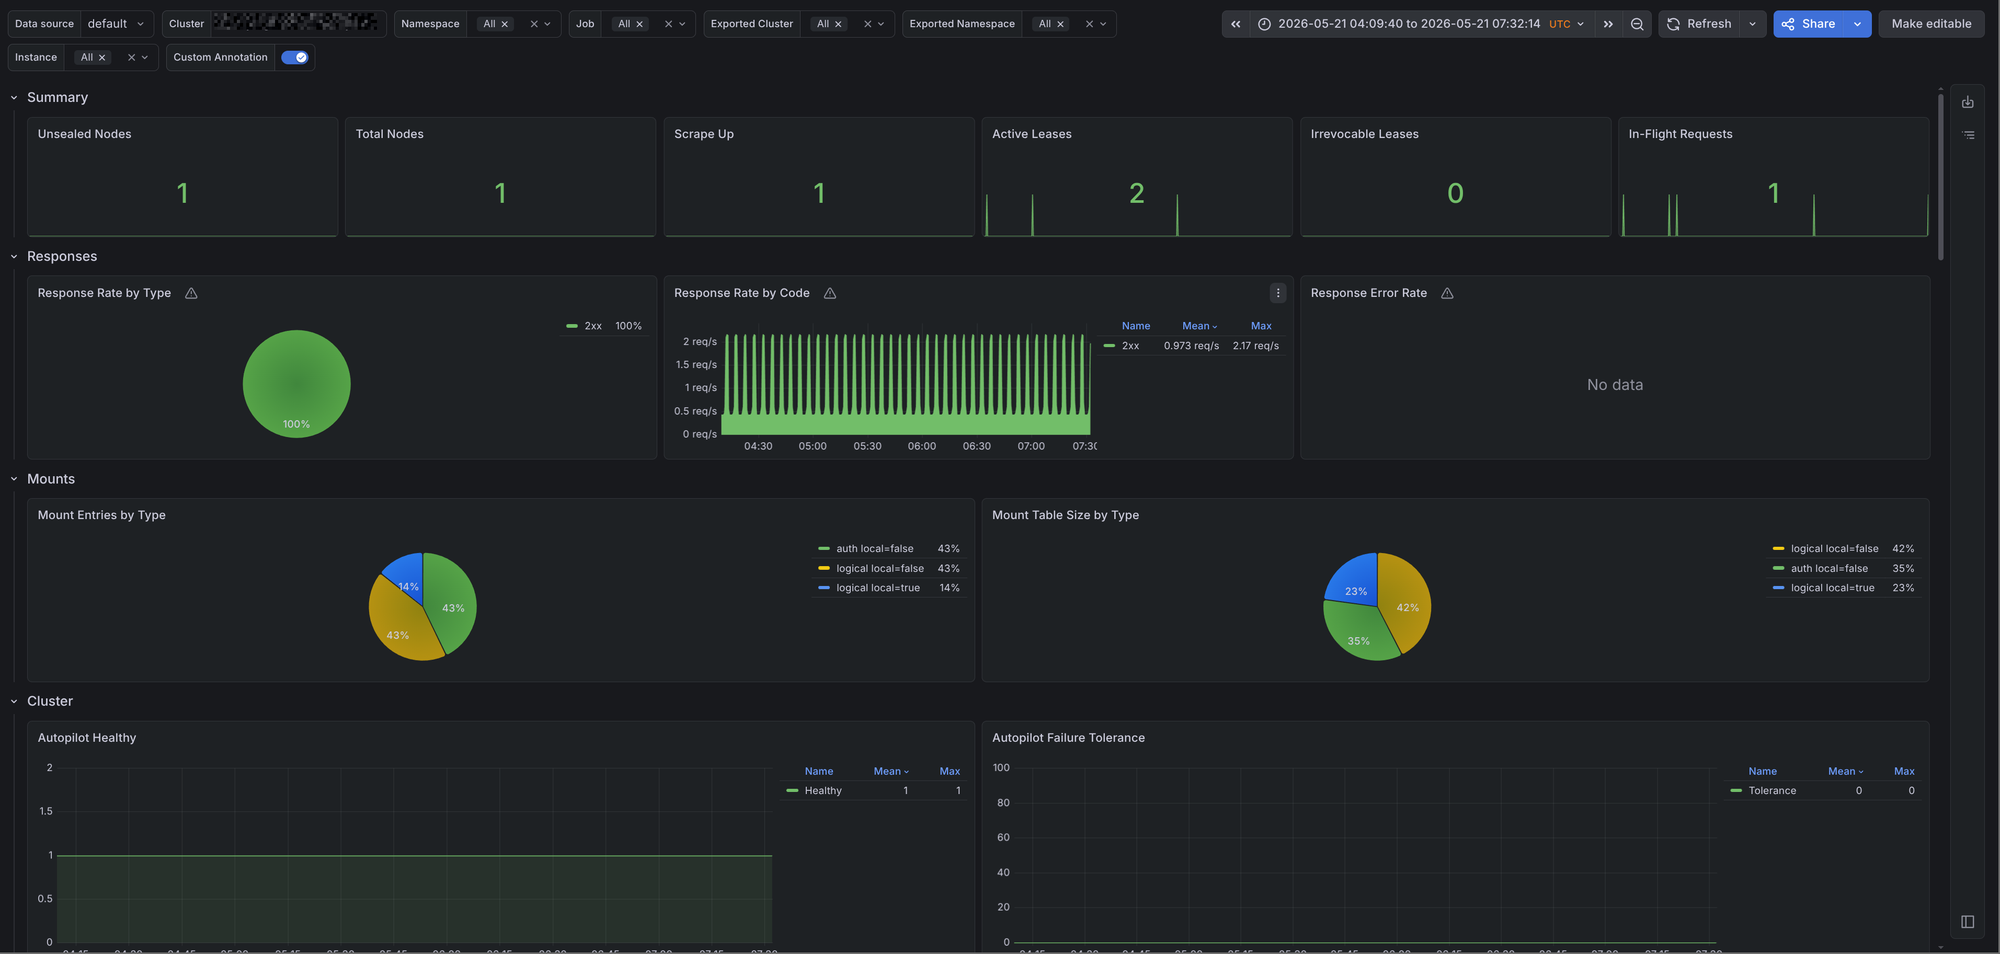
- Summary - Displays unsealed nodes, total nodes, scrape health, active leases, irrevocable leases, and in-flight requests.
- Responses - Shows response rate by status type and the Vault response success rate.
- Mounts - Shows mount table entries and mount table size by type.
- Cluster - Displays active node state, Autopilot health, failure tolerance, replication status, leadership changes, Raft commit latency, Raft apply rate, and peer indexes.
- Raft storage - Displays BoltDB page usage, free pages, write count, and write time by database.
- Requests - Shows request rate, login request rate, and request latency.
- Tokens - Displays available tokens, tokens by auth method, and token operations.
- Audit - Shows audit request and response rates, alongside audit logging failures.
- Runtime - Displays Go runtime and process metrics such as memory, goroutines, GC, allocations, CPU, open file descriptors, and cache hit rate.

The runtime row is intentionally small. If you want a deeper view into Go runtime internals, pair this dashboard with the Go / Overview dashboard from the go-mixin project.
Alerts
Alerts are trickier to get right for a generic use case, however they're still provided by the vault-mixin. You can configure alerts using the config.libsonnet file in the repository. If you're familiar with Jsonnet, customizing these alerts is straightforward. The alerts can be found on GitHub, and I'll add a description for the alerts below.
VaultSealed- Alerts when a Vault instance is sealed. This is a critical alert because the instance cannot serve normal secret operations until it is unsealed.VaultTooManyInfinityTokens- Alerts when an instance has more than three non-expiring tokens for five minutes. Long-lived tokens are sometimes needed, but they should be rare and easy to account for.VaultAutopilotUnhealthy- Alerts when Vault Autopilot reports an unhealthy state for five minutes. This usually points to Raft cluster health problems.VaultNoActiveNode- Alerts when a Vault cluster has no active node for five minutes. Without an active node, the cluster cannot handle normal requests.VaultLowResponseSuccessRate- Alerts when fewer than 95% of Vault responses are non-5xxresponses and the instance is returning more than one5xxresponse per second. This helps avoid alerting on a single failed request.VaultRaftFSMPendingHigh- Alerts when a Raft peer has more than 100 pending FSM operations for five minutes. A growing pending queue can mean Raft is falling behind.VaultAuditFailures- Alerts when Vault audit request or response logging failures occur for five minutes. Audit logging failures should be treated seriously because Vault audit logs are often required for incident response and compliance.