
Tailscale is a popular VPN solution that allows you to create secure, encrypted connections between devices. It is based on the WireGuard protocol and is designed to be easy to use and configure. Recently, I've started using Tailscale more extensively both in my personal projects and at work. As a result, I wanted to visualize my Tailnet in Grafana to get better insights into its performance and usage. This post introduces the tailscale-exporter, a tool I built to collect Tailnet metrics directly from the Tailscale API. I’ll also show how to enable scraping of Tailscale client metrics and visualize everything in Grafana for complete observability across your Tailnet.
The repository can be found at GitHub. There's also a monitoring mixin that provides Grafana dashboards and Prometheus alerts, which you find at GitHub. A Docker image, and a Helm chart is available too to easily deploy the exporter.
The exporter currently supports the following features:
- Comprehensive Device Metrics: Detailed per-device metrics
- API Key Management: Metrics for all API keys
- DNS Configuration: DNS settings
- User Management: User metrics
- Tailnet Settings: Tailnet Configuration
- API Health: Monitoring of Tailscale API accessibility
Deploying the Tailscale-exporter
The example below uses Helm to deploy the exporter into a Kubernetes cluster. You can also run it as a standalone binary or a Docker container if you prefer.
The exporter requires access to the Tailscale API, which is authenticated using an OAuth client. First, create an OAuth client in your Tailscale admin console and grant it read access to your Tailnet.
Once you have the client ID and secret, store them securely in a Kubernetes secret:
kubectl create secret generic tailscale-oauth \
  --from-literal=client-id=<your-client-id> \
  --from-literal=client-secret=<your-client-secret> \
  --namespace monitoring
Next, we'll reference that secret in the Helm values file. Create a values.yaml file with the following content:
env:
- name: TAILSCALE_OAUTH_CLIENT_ID
  valueFrom:
    secretKeyRef:
      key: client-id
      name: tailscale-oauth
- name: TAILSCALE_OAUTH_CLIENT_SECRET
  valueFrom:
    secretKeyRef:
      key: client-secret
      name: tailscale-oauth
- name: TAILSCALE_TAILNET
  value: <your-tailnet>
Also, if you’re using the prometheus-operator, make sure to enable the ServiceMonitor in the Helm values so Prometheus can automatically discover and scrape the exporter:
serviceMonitor:
  enabled: true
Finally, install the Helm chart:
helm repo add adinhodovic https://adinhodovic.github.io/tailscale-exporter
helm repo update
helm install tailscale-exporter adinhodovic/tailscale-exporter \
    --namespace monitoring \
    -f values.yaml
If everything works as expected you should see the exporter running and exposing metrics at http://<exporter-service>:8080/metrics. You should be able to query the metrics in Prometheus.
Scraping Tailscale Client Metrics
Tailscale also comes with client metrics that can be scraped. These metrics provide insights into the performance and usage of individual Tailscale clients. There's documentation from around this feature at Tailscale's website. The tailscale-mixin comes with Grafana dashboards and Prometheus alerts to visualize and monitor these metrics.
To enable client metrics scraping, you need to configure each Tailscale client to expose metrics. I'll add some examples below.
First, serve the metrics on a port:
tailscale web --readonly --listen adin.airplane-pangolin.ts.net:5253
Note: You can also run tailscale set --webclient to serve the metrics. However, this command only accepts an IP address as the host. Any queries using the Tailnet DNS name will be redirected to the corresponding IP. In our setup, that IP isn’t resolvable from within the Kubernetes environment where Prometheus runs, so this approach doesn’t work. Hopefully, future versions of Tailscale will allow the webserver to accept the --listen flag for more flexible binding options.
To scrape the metrics, add a Prometheus scrape_config pointing to the exposed client endpoint. Below is an example configuration you can adapt:
scrape_configs:
  - job_name: 'tailscale-client'
    metrics_path: /metrics
    static_configs:
      - targets:
          - 'adin.airplane-pangolin.ts.net:5253'
    relabel_configs:
      - target_label: tailscale_machine
        replacement: 'adin'
This configuration will make Prometheus scrape the metrics endpoint served by the Tailscale client.
Exposing Tailscale Client Metrics in Kubernetes
The operator supports several powerful use cases - one of which is exposing a Tailnet service within the cluster. We'll use that feature to make the client metrics reachable by Prometheus.
We'll deploy a Kubernetes Service annotated with tailscale.com/tailnet-fqdn, set to the DNS name of the Tailscale client. This instructs the tailscale-operator to create a Service endpoint inside the cluster that transparently routes traffic to the corresponding Tailscale node.
apiVersion: v1
kind: Service
metadata:
  annotations:
    tailscale.com/proxy-class: default-egress
    tailscale.com/proxy-group: default-egress
    tailscale.com/tailnet-fqdn: adin.airplane-pangolin.ts.net
  labels:
    app.kubernetes.io/name: tailscale-external-nodes
  name: tailscale-external-node-adin-desktop
  namespace: gateway
spec:
  externalName: tailscale-adin-placeholder
  ports:
  - name: metrics
    port: 5253
    targetPort: 5253
  type: ExternalName
The annotations tailscale.com/proxy-class and tailscale.com/proxy-group are optional and depend on your tailscale-operator setup. When specified, they instruct the operator to create a Deployment (typically with 3 pods) that acts as an egress proxy for the target Tailnet device. This allows traffic from the Kubernetes cluster to be routed efficiently through multiple proxy instances to the desired Tailscale node, improving reliability for metrics scraping or other use cases.
Now that the Tailscale client’s metrics endpoint is exposed inside the Kubernetes cluster, the final step is to configure Prometheus to scrape it. If you’re using the prometheus-operator, you can define a ScrapeConfig resource to collect metrics from the service we created earlier:
apiVersion: monitoring.coreos.com/v1alpha1
kind: ScrapeConfig
metadata:
  name: tailscale-external-node-adin-desktop
  namespace: gateway
spec:
  relabelings:
  - action: replace
    replacement: adin
    targetLabel: tailscale_machine # Add a label to identify the machine
  staticConfigs:
  - targets:
    - tailscale-external-node-adin-desktop.gateway.svc:5253 # The service we created earlier
It’s important to note that the tailscale_machine label is what uniquely identifies each client in the metrics. This label is used throughout the Grafana dashboards provided by the tailscale-mixin to distinguish between different Tailscale clients and visualize their individual performance and status.
Here's a mermaid diagram that illustrates the flow of metrics from the Tailscale client to Prometheus:
Now that both the client metrics and the Tailnet-wide metrics are being scraped by Prometheus, we can visualize them in Grafana using the dashboards included in the tailscale-mixin.
Scraping Tailscale-operator Clients
When using the tailscale-operator, you can also scrape metrics from the Tailscale clients it manages. In this case, each ProxyGroup represents a Tailscale client controlled by the operator. You can create a corresponding Service for each ProxyGroup to expose its metrics endpoint within the Kubernetes cluster.
Next, let’s take a look at the CustomResourceDefinitions (CRDs) for these underlying ProxyGroup resources. We’ll start with the ProxyClass, which defines the configuration for the proxies.
apiVersion: tailscale.com/v1alpha1
kind: ProxyClass
metadata:
  name: default-egress
  namespace: gateway
spec:
  metrics:
    enable: true
    serviceMonitor:
      enable: false
We'll disable the serviceMonitor as we want the tailscale_machine label added to the metrics.
Next, we create a ProxyGroup that uses the ProxyClass defined above:
apiVersion: tailscale.com/v1alpha1
kind: ProxyGroup
metadata:
  name: default-egress
  namespace: gateway
spec:
  proxyClass: default-egress
  replicas: 1
  type: egress
Lastly, we'll need to create a ServiceMonitor that scrapes the metrics from the ProxyGroup service. This ServiceMonitor will also add the tailscale_machine label to identify the client:
apiVersion: monitoring.coreos.com/v1
kind: ServiceMonitor
metadata:
  labels:
    app.kubernetes.io/name: tailscale-proxy-group-default-egress
  name: tailscale-proxy-group-default-egress
  namespace: gateway
spec:
  endpoints:
  - port: metrics
    relabelings:
    - action: replace
      sourceLabels:
      - __meta_kubernetes_pod_name
      targetLabel: tailscale_machine
  namespaceSelector:
    matchNames:
    - gateway
  selector:
    matchLabels:
      ts_prom_job: ts_proxygroup_default-egress
      ts_proxy_parent_name: default-egress
      ts_proxy_type: proxygroup
  targetLabels: # Additional labels to easily identify proxies
  - ts_proxy_parent_name
  - ts_proxy_parent_namespace
  - ts_proxy_type
The operator applies a consistent labeling convention that simplifies resource selection. In this setup, we use the labels ts_proxy_parent_name and ts_proxy_type to target the appropriate ProxyGroup service.
With this configuration, Prometheus can now scrape client metrics from both external and in-cluster Tailscale clients, making them available for visualization in Grafana.
Grafana Dashboards
Upcoming sections describe each dashboard.
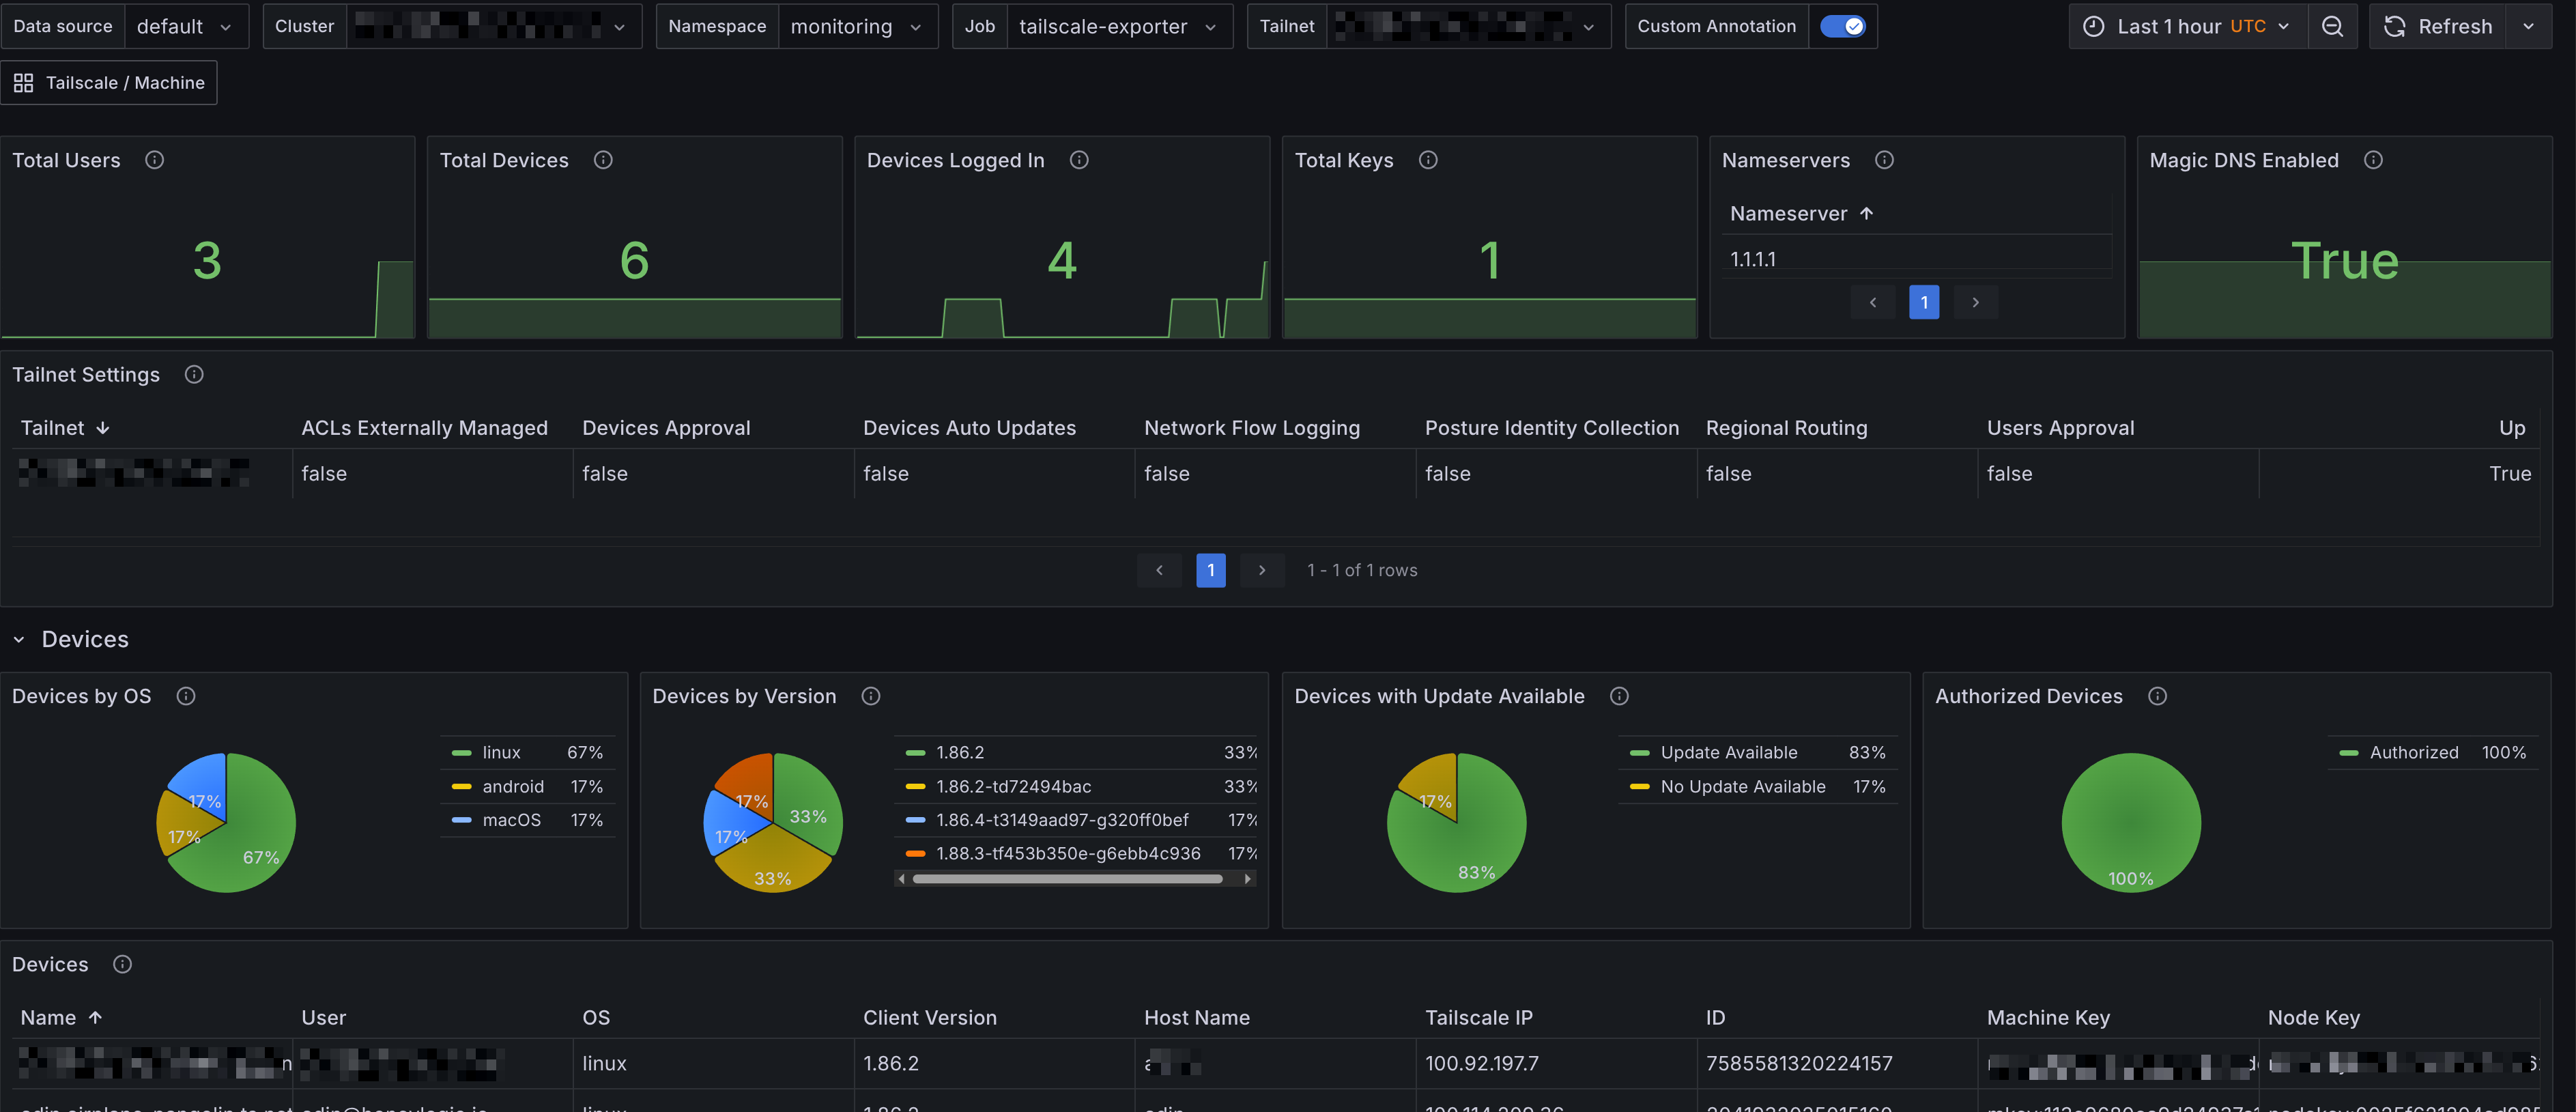
Tailscale Overview
The Grafana dashboard for Tailscale Overview provides a comprehensive view of your Tailnet's performance and usage. It includes panels that display:
- Summary - Provides an overview of the Tailnet, including the total number of devices, users, nameservers, keys and Tailnet settings.
- Devices - Displays the status of devices in the Tailnet, including their online/offline status, last seen time, and IP addresses. It also includes a table of devices with their details and a panel showing the number of devices by operating system.
- Users - Shows the number of users in the Tailnet and their last seen time. It also includes a table of users with their status, role and other details.
- Keys - Displays the number of keys in the Tailnet and their creation time. It also includes a table of keys with their details.
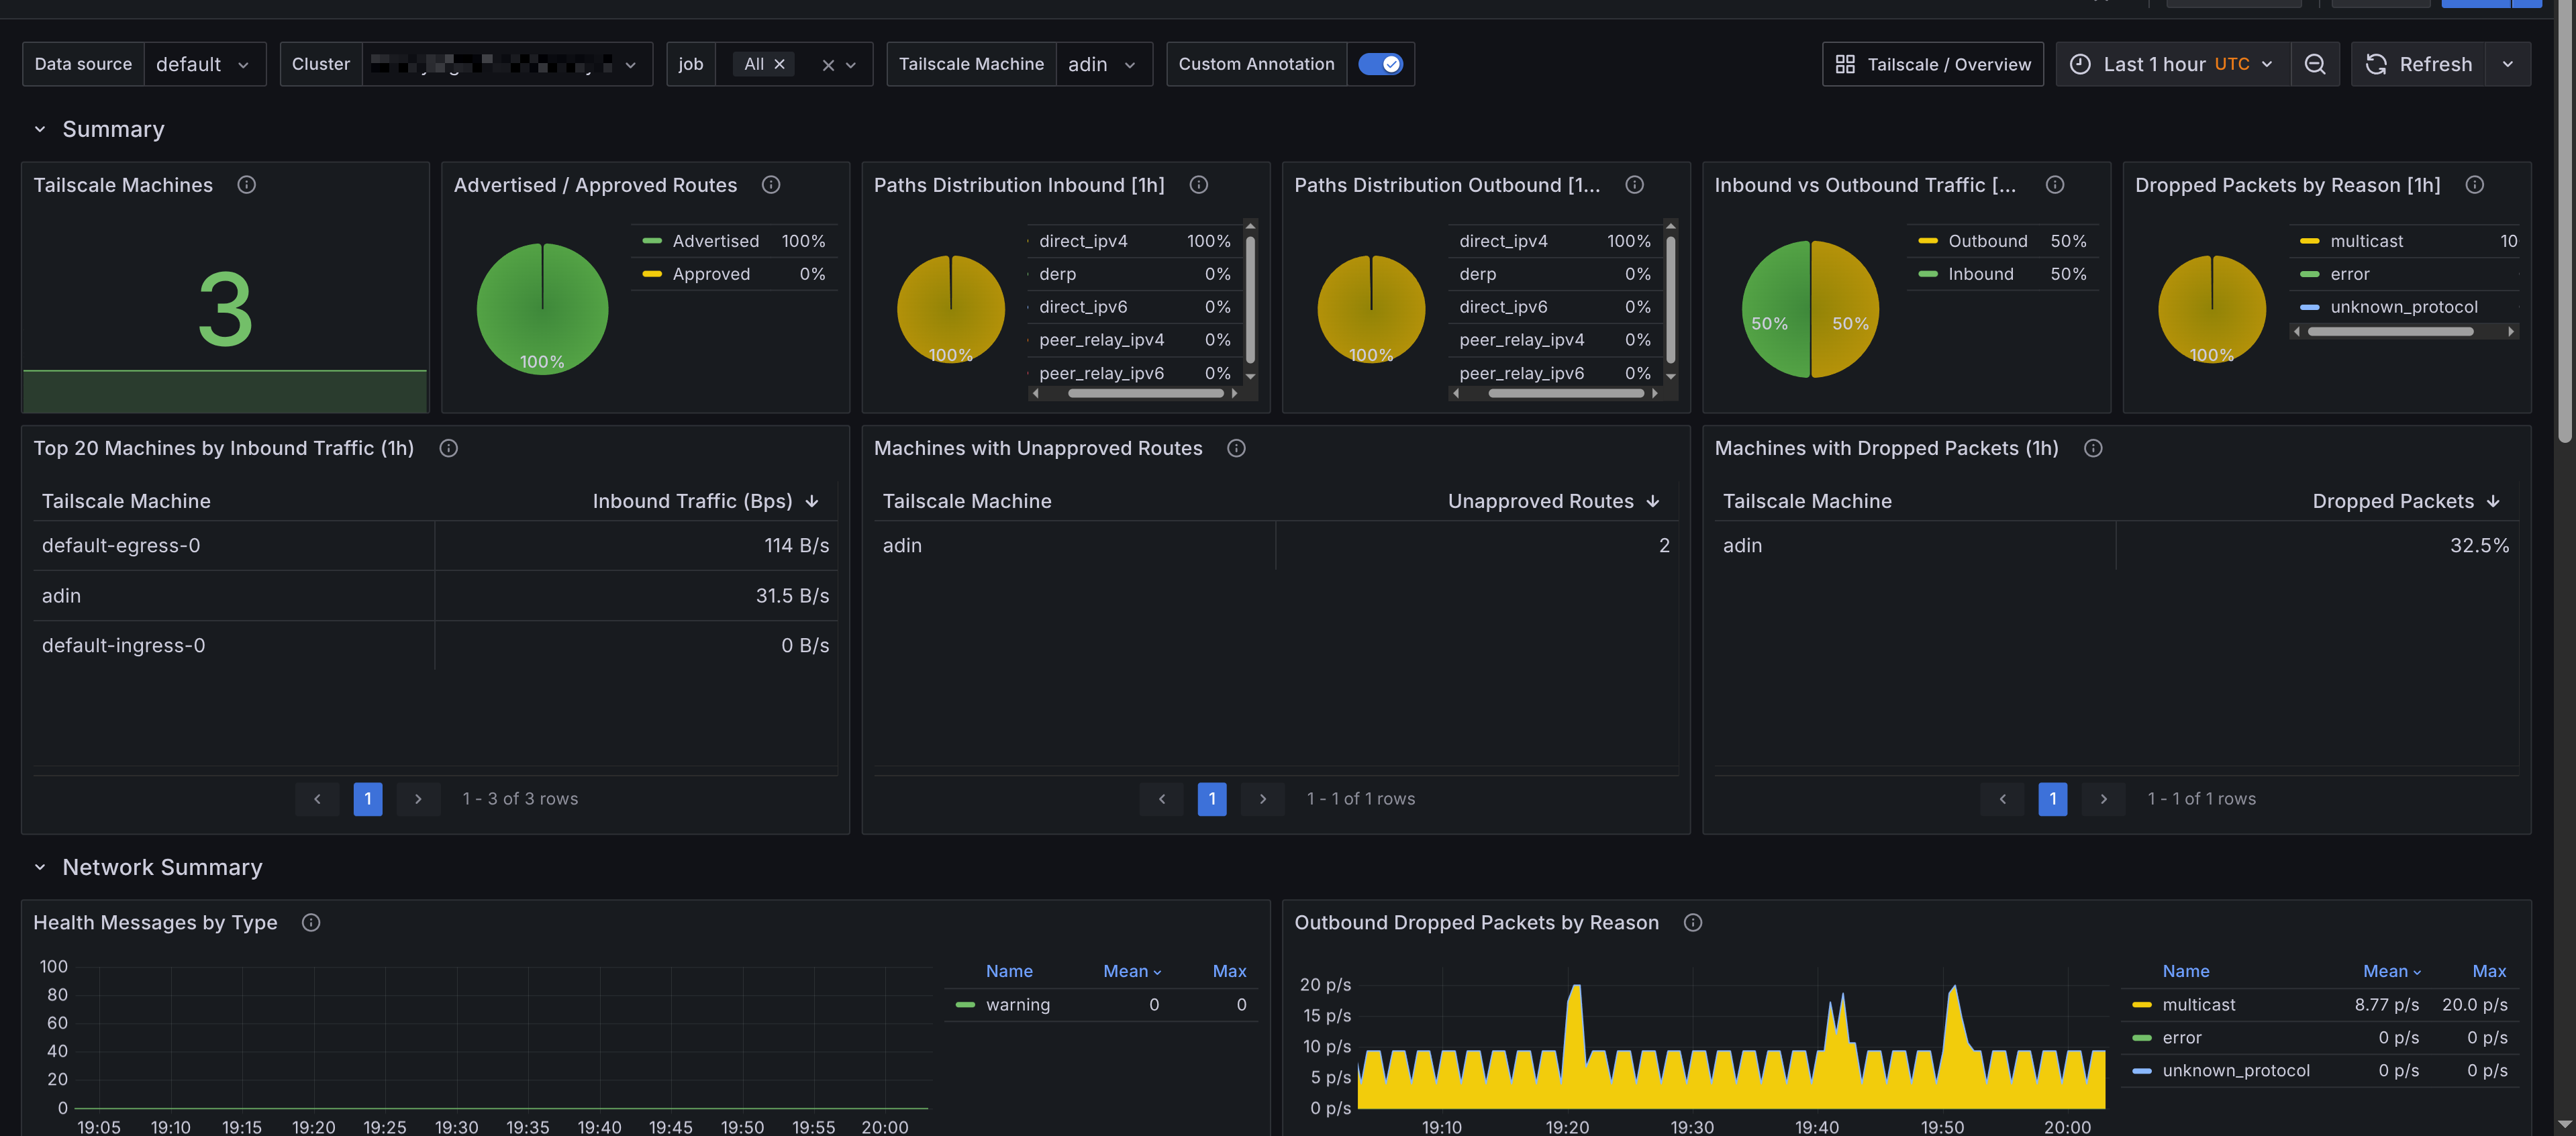
Tailscale Clients
The Grafana dashboard for Tailscale Clients provides detailed insights into the performance and usage of individual Tailscale clients. It includes panels that display:
- Summary - Provides an overview of the Tailscale clients, including the total number of clients, dropped packets, unapproved routes and other key metrics.
- Network Summary - Displays network-related metrics for the clients, including bytes sent/received and packets sent/received.
- Tailscale Machine - A breakdown for each Tailscale client, showing metrics such as bytes sent/received, packets sent/received, dropped packets, and unapproved routes. This section allows you to monitor the performance of individual clients in detail.
Prometheus Alerts
Alerts are trickier to get right for a generic use case, however they're still provided by the tailscale-mixin. They're also configurable with the config.libsonnet package in the repository, if you are familiar with Jsonnet then customizing the alerts should be fairly straight forward. Alerts are available on GitHub, and I'll add a description for the alerts below.
Tailnet Alerts
- Alert name:
TailscaleDeviceUnauthorized
Alerts when a Tailscale device is unauthorized.
- Alert name:
TailscaleUserUnapproved
Alerts when a Tailscale user is unapproved.
- Alert name:
TailscaleUserRecentlyCreated
Alerts when a Tailscale user was recently created. A fun alert to have, but you can choose to not deploy it.
- Alert name:
TailscaleDeviceUnapprovedRoutes
Alerts when a Tailscale device has unapproved routes. This indicates that the device is advertising routes that have not been approved by the Tailnet administrator.
Tailscale Client Alerts
- Alert name:
TailscaledMachineHighOutboundDroppedPackets
Alerts when a Tailscale client has a high number of outbound dropped packets. This could indicate network issues or misconfigurations on the client side.