
Over the years I've written several blog posts covering different parts of Django observability - Django Monitoring with Prometheus and Grafana, Django Development and Production Logging, Celery Monitoring with Prometheus and Grafana, and Django Error Tracking with Sentry. Each post covers one piece: wiring up django-prometheus, configuring structlog, deploying the Celery exporter, setting up distributed tracing. The problem is that wiring all of it by hand across every project is repetitive and easy to get wrong.
django-o11y bundles those patterns into a single installable package. One DJANGO_O11Y settings dict gets you traces, structured logs, Prometheus metrics, and optional Pyroscope profiling - with all four signals correlated on trace_id.
The documentation is at adinhodovic.github.io/django-o11y.
Installation
pip install django-o11y
Or install everything at once:
pip install django-o11y[all]
You can also install only what you need. The available extras are celery, profiling, postgres, redis, http, aws, and channels.
Basic setup
Add django_o11y and django_prometheus to INSTALLED_APPS, add the middlewares, and call build_logging_dict():
from django_o11y.logging.setup import build_logging_dict

LOGGING = build_logging_dict()

INSTALLED_APPS = [
    "django_o11y",
    "django_prometheus",
    # ...
]

MIDDLEWARE = [
    "django_prometheus.middleware.PrometheusBeforeMiddleware",

    "django.middleware.security.SecurityMiddleware",
    "django.contrib.sessions.middleware.SessionMiddleware",
    "django.middleware.common.CommonMiddleware",
    "django.middleware.csrf.CsrfViewMiddleware",
    "django.contrib.auth.middleware.AuthenticationMiddleware",

    # After auth so request.user is available
    "django_o11y.tracing.middleware.TracingMiddleware",
    "django_o11y.logging.middleware.LoggingMiddleware",

    "django.contrib.messages.middleware.MessageMiddleware",
    "django.middleware.clickjacking.XFrameOptionsMiddleware",

    "django_prometheus.middleware.PrometheusAfterMiddleware",
]
Then configure the package via DJANGO_O11Y:
DJANGO_O11Y = {
    "SERVICE_NAME": "my-django-app",
    "RESOURCE_ATTRIBUTES": {
        "deployment.environment": "production",
        "service.namespace": "web",
    },
    "TRACING": {
        "ENABLED": True,
        "OTLP_ENDPOINT": "http://localhost:4317",
    },
    "METRICS": {"PROMETHEUS_ENABLED": True},
}
Expose the metrics endpoint in urls.py:
from django_o11y import get_urls

urlpatterns = [
    # ...
] + get_urls()
get_urls() adds /metrics (configurable via METRICS.PROMETHEUS_ENDPOINT).
Metrics
Metrics come from django-prometheus. The middleware wraps the request/response cycle, and swapping the database and cache backends gives you query counts, latency, and cache hit rates:
DATABASES = {
    "default": {
        "ENGINE": "django_prometheus.db.backends.postgresql",
        # ...
    }
}

CACHES = {
    "default": {
        "BACKEND": "django_prometheus.cache.backends.redis.RedisCache",
        # ...
    }
}
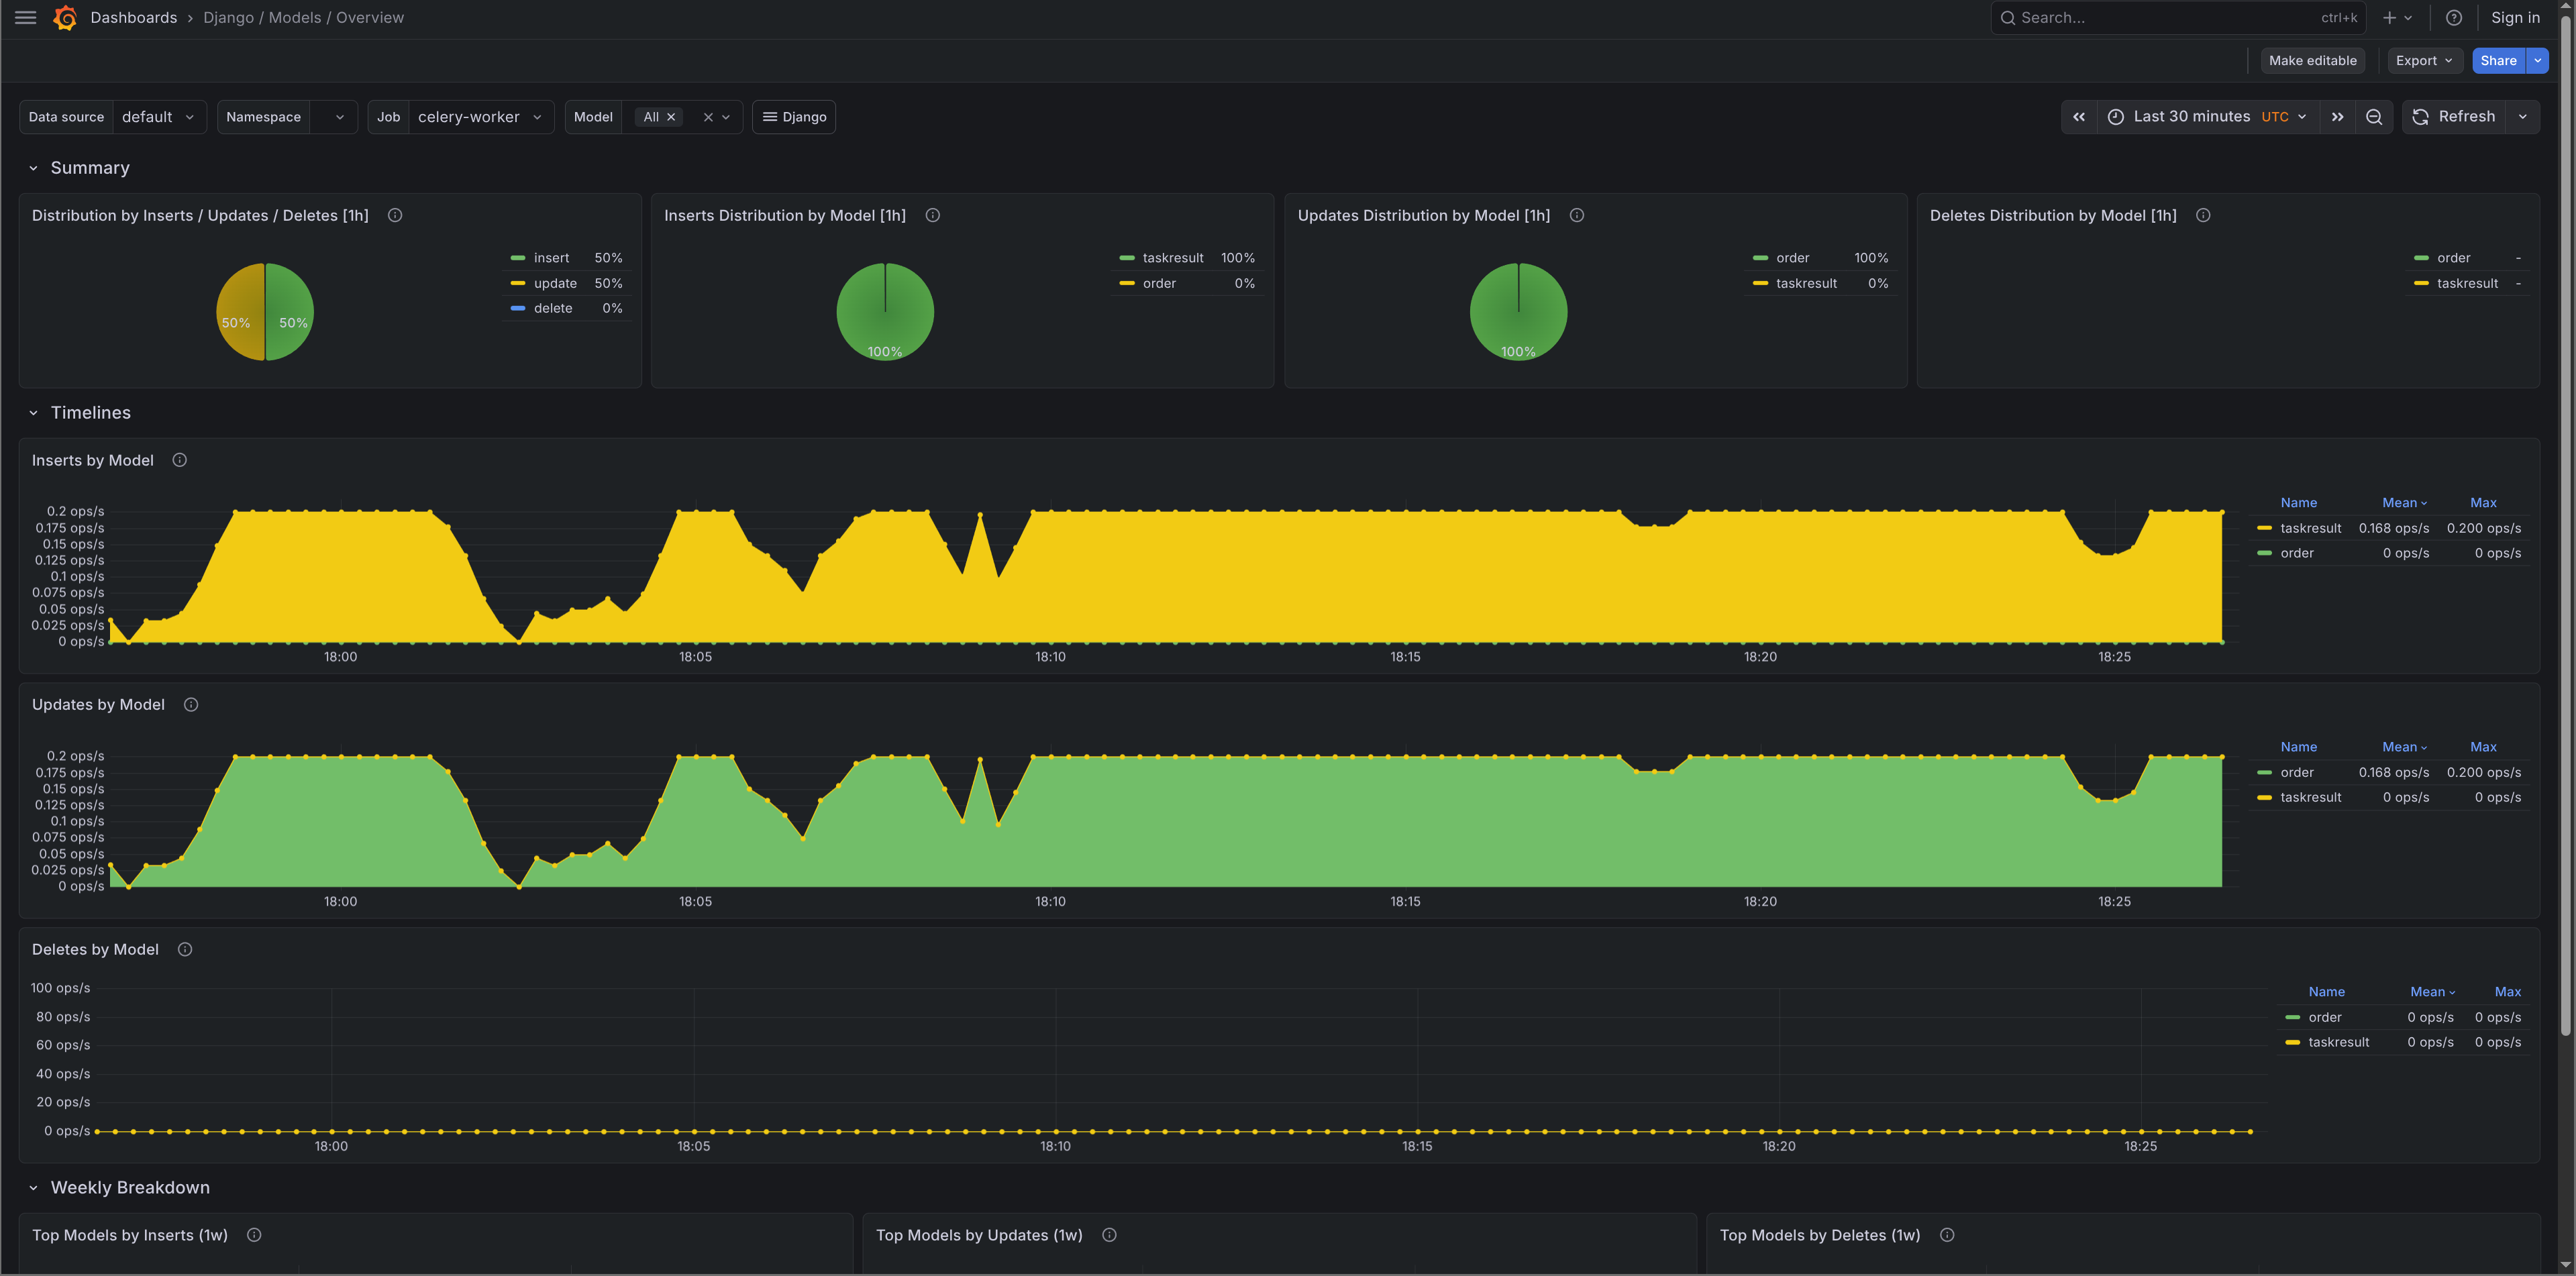
Migration metrics are enabled automatically. They power the migrations panel in the Django Overview dashboard and the DjangoMigrationsUnapplied alert.
For custom business metrics there's a thin counter()/histogram() API:
from django_o11y.metrics import counter, histogram

payment_counter = counter(
    "payments_processed_total",
    description="Total payments processed",
    labelnames=["status", "method"],
)
payment_counter.add(1, {"status": "success", "method": "card"})

payment_latency = histogram(
    "payment_processing_seconds",
    description="Payment processing time",
    labelnames=["method"],
)
with payment_latency.time({"method": "card"}):
    result = process_payment()
Custom metrics appear on the same /metrics endpoint as the infrastructure metrics.
The Grafana dashboards and alerts are from django-mixin - the same dashboards covered in Django Monitoring with Prometheus and Grafana.
Celery metrics
Celery metrics come from celery-exporter. When CELERY.ENABLED is True and a broker URL is found in your settings, django-o11y sets worker_send_task_events = True and task_send_sent_event = True on startup - no extra Celery configuration needed.
The local dev stack (covered below) adds the exporter automatically.
Logs
Structured logging via structlog and django-structlog. Every log line gets trace_id and span_id injected automatically, so logs and traces correlate in Grafana without any extra work.
from django_o11y.logging.utils import get_logger

logger = get_logger()

logger.info("order_placed", order_id=order_id, amount=total)
logger.error("payment_failed", error=str(e), order_id=order_id)
get_logger() infers the module name - no need to pass __name__. Use keyword arguments rather than f-strings to keep logs machine-readable and queryable in Loki.
In development (DEBUG=True) output is colorized console:
2026-02-12T10:30:45 [info ] order_placed order_id=123 amount=49.99 [views.py:42]
In production (DEBUG=False) it switches to JSON automatically:
{
  "event": "order_placed",
  "order_id": 123,
  "amount": 49.99,
  "trace_id": "a1b2c3d4e5f6g7h8",
  "span_id": "i9j0k1l2",
  "timestamp": "2026-02-12T10:30:45.123Z",
  "level": "info",
  "logger": "myapp.views",
  "filename": "views.py",
  "lineno": 42
}
For Celery workers, django-o11y hooks setup_logging to apply settings.LOGGING via dictConfig in each worker process. Worker logs use the same format as the web process with no separate configuration. django-structlog emits structured task_started, task_succeeded, and task_failed events automatically, each carrying task_id, task_name, duration_ms, and trace_id/span_id.
Tracing
Distributed tracing via OpenTelemetry. Requests, database queries, cache operations, and outbound HTTP calls are instrumented automatically based on which extras are installed.
DJANGO_O11Y = {
    "TRACING": {
        "ENABLED": True,
        "OTLP_ENDPOINT": "http://localhost:4317",
        "SAMPLE_RATE": 1.0,
    }
}
Auto-instrumentation covers Django HTTP requests, PostgreSQL (psycopg2 and psycopg v3), MySQL, SQLite, Redis, Celery tasks, outbound HTTP via requests/urllib3/httpx, and AWS SDK calls via botocore. Each span includes the relevant metadata - method, route, status code, SQL, cache key, etc.
Celery tracing
pip install django-o11y[celery]
DJANGO_O11Y = {
    "CELERY": {
        "ENABLED": True,
    }
}
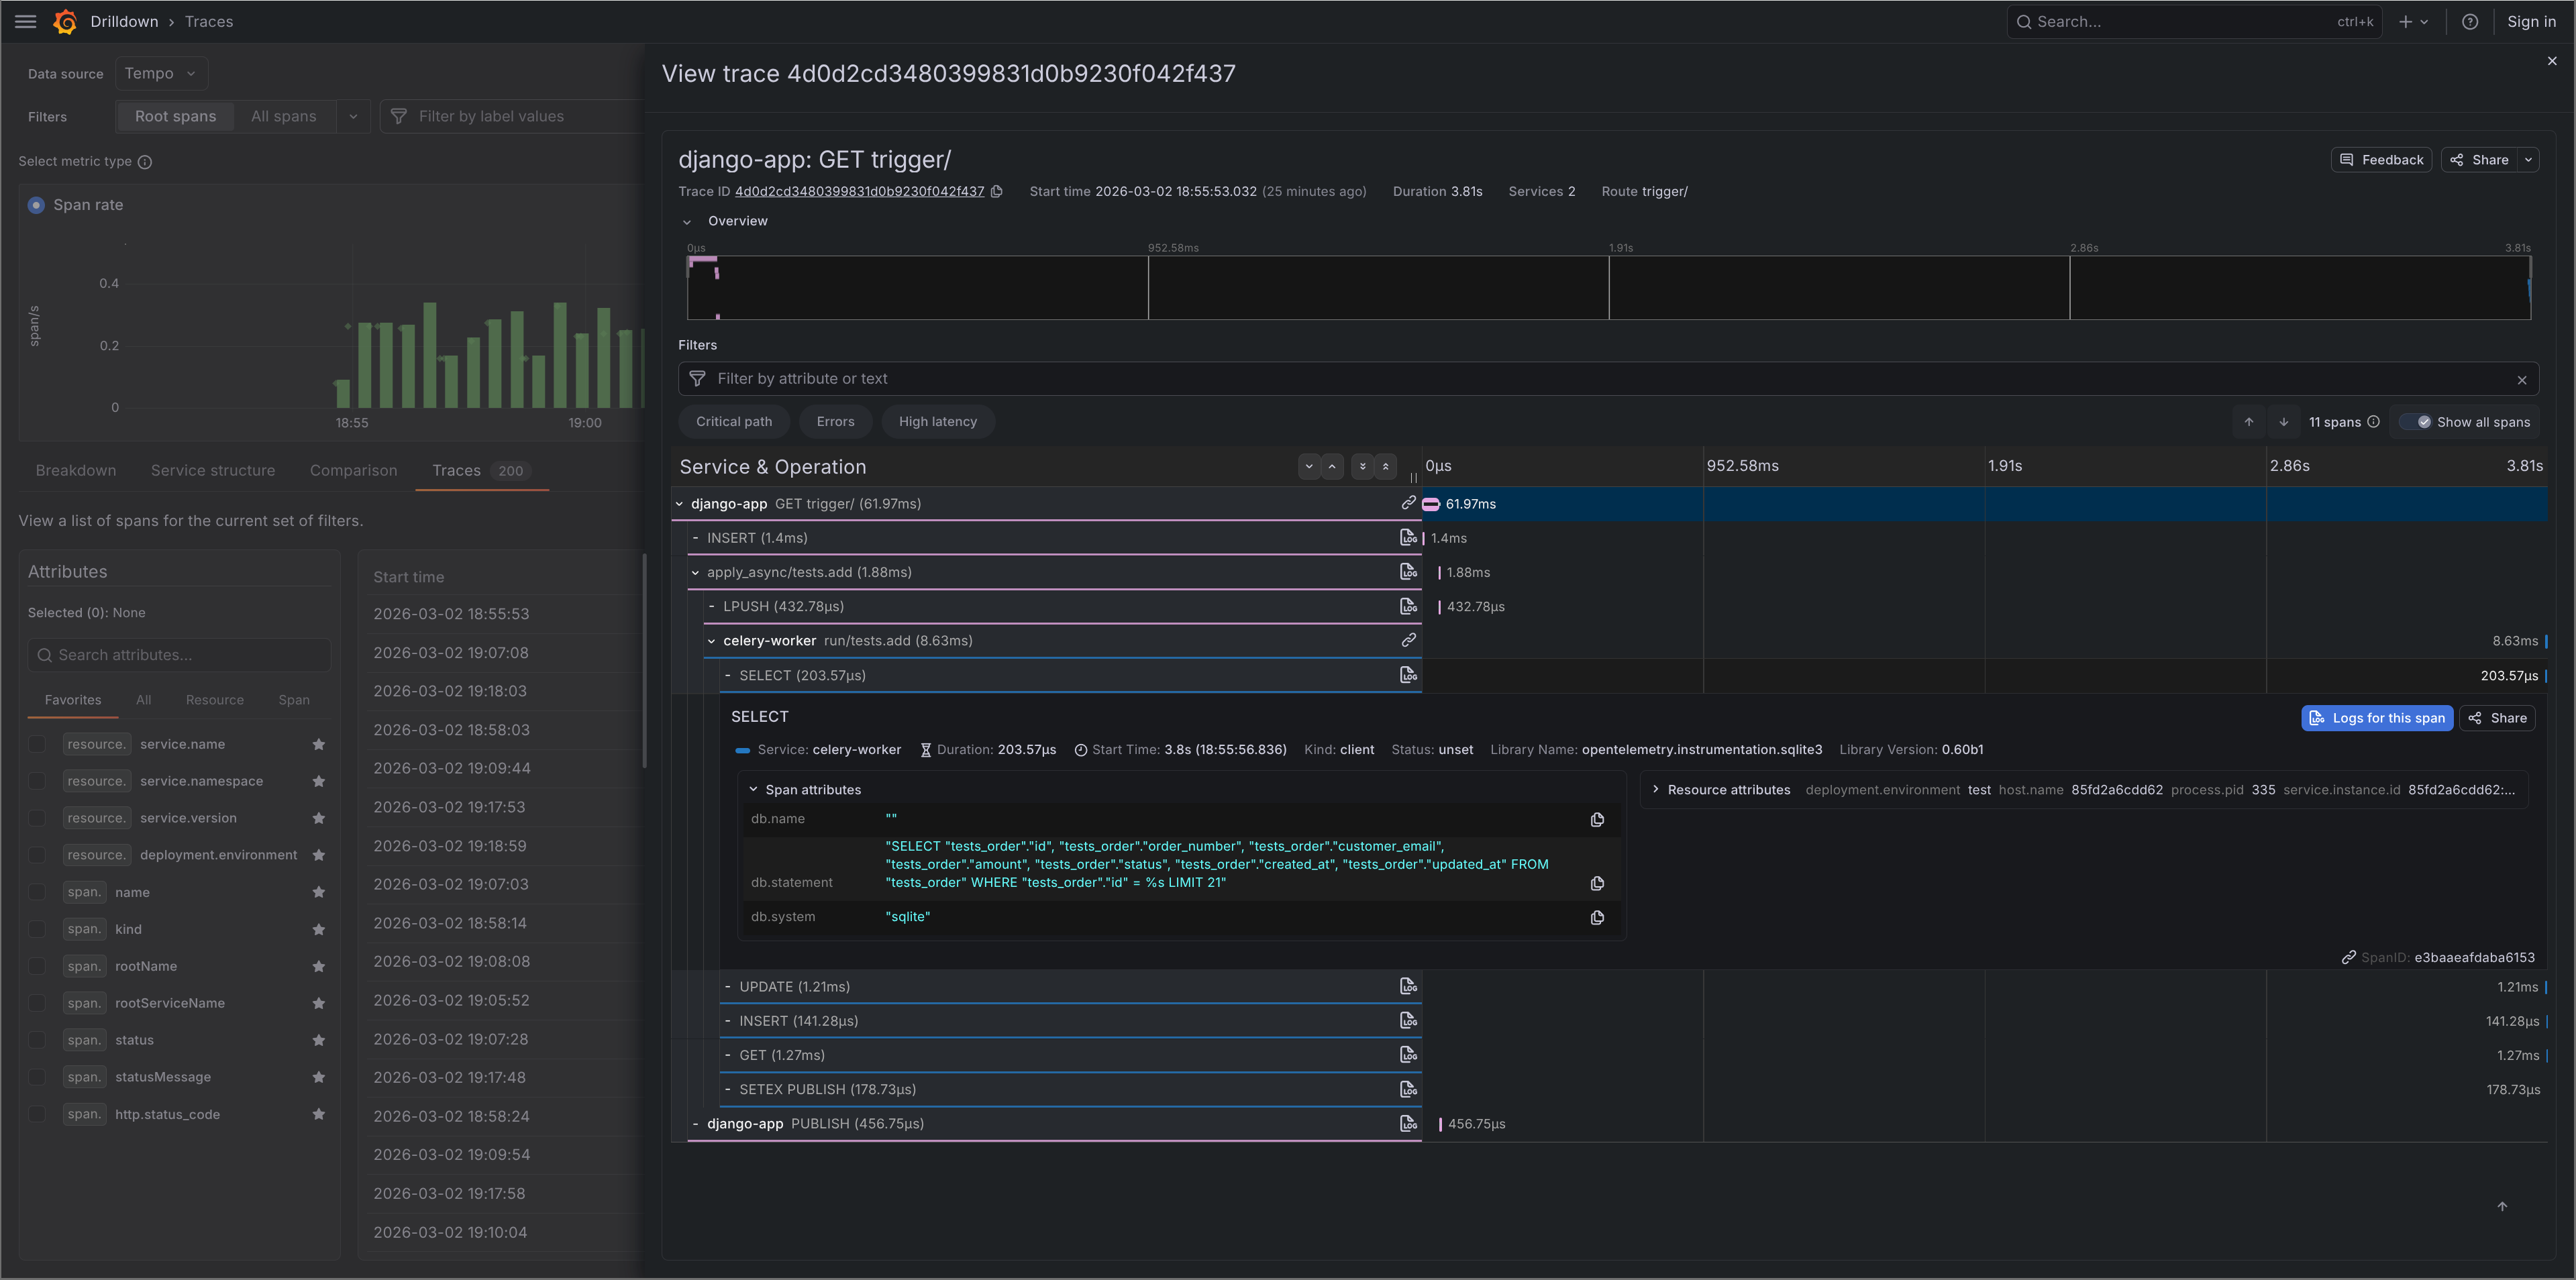
Each task gets a trace span linked to the originating request via W3C TraceContext propagation through the broker. You can follow a request from the HTTP layer into a background task in a single trace.
from celery import shared_task

from django_o11y.logging.utils import get_logger
from django_o11y.tracing.utils import set_custom_tags

logger = get_logger()

@shared_task
def process_order(order_id: int):
    set_custom_tags({"order_id": order_id})
    logger.info("order_processing_started", order_id=order_id)
    result = do_processing(order_id)
    logger.info("order_processing_completed", order_id=order_id)
    return result
Profiling
Continuous profiling via Pyroscope is disabled by default. To enable it:
pip install django-o11y[profiling]
DJANGO_O11Y = {
    "PROFILING": {
        "ENABLED": True,
        "PYROSCOPE_URL": "http://localhost:4040",
    }
}
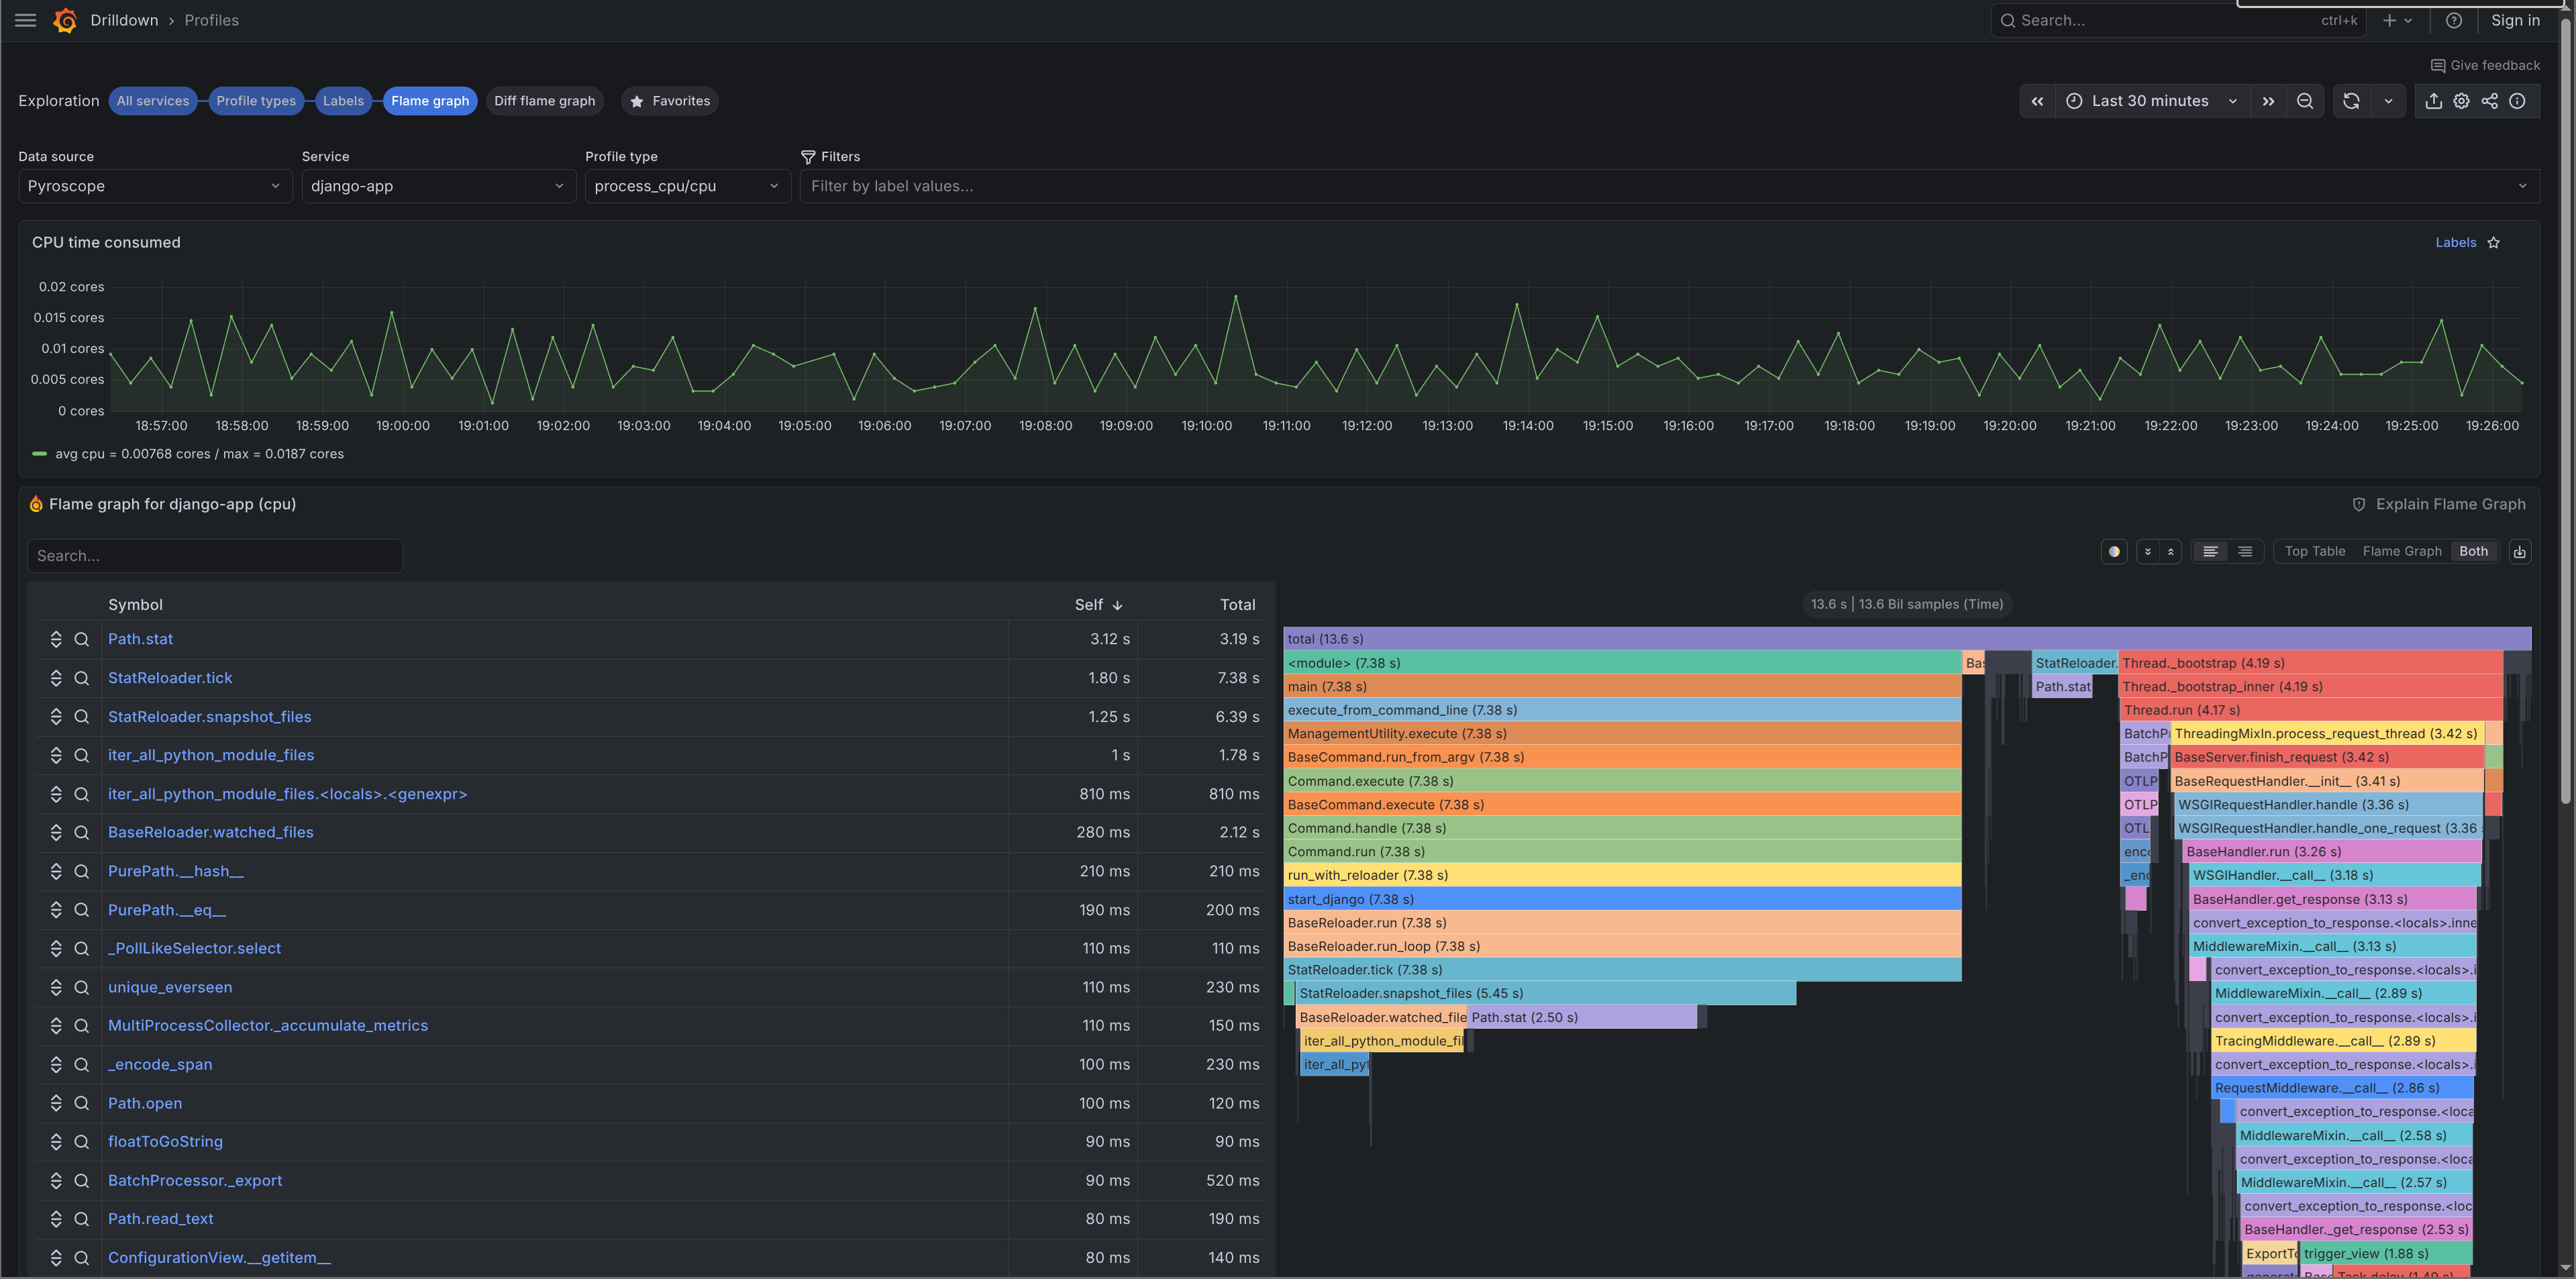
Profiles are pushed to Pyroscope on startup and visible in Grafana under Explore → Pyroscope. For Celery prefork workers, django-o11y handles the worker_process_init signal so profiling initialises correctly in each worker child process.
Adding context
Logs, traces, and profiles share the same context API:
from django_o11y.logging.utils import add_log_context
from django_o11y.tracing.utils import set_custom_tags, add_span_attribute

# Logs + traces
set_custom_tags({"tenant_id": "acme", "feature": "checkout_v2"})

# Logs only
add_log_context(tenant_id="acme", checkout_variant="B")

# Span only
add_span_attribute("cart_size", len(cart.items))
RESOURCE_ATTRIBUTES from the config are also merged into Pyroscope tags, so profiles carry the same metadata as traces.
Local dev stack
This is probably the part I find most useful day-to-day. The o11y management command spins up a full local observability stack with one command. Screenshots of what the stack looks like are in the demo stack docs.
python manage.py o11y stack start
This starts Grafana, Prometheus, Tempo, Loki, Pyroscope, and Alloy via Docker Compose, with the Grafana dashboards already imported. Prometheus scrapes /metrics from your app. Alloy receives OTLP traces and forwards them to Tempo, tails the dev log file and ships it to Loki, and forwards profiling data to Pyroscope.
# Stop
python manage.py o11y stack stop

# Check status
python manage.py o11y stack status

# Tail logs
python manage.py o11y stack logs --follow
There's also a check command that verifies your config, tests OTLP connectivity, and sends a test trace:
python manage.py o11y check
Summary
django-o11y is the result of applying the same observability patterns across multiple Django projects and getting tired of wiring them up each time. The goal is a single package that gives you a production-ready observability stack with sensible defaults you can override when needed. The documentation and configuration reference are at adinhodovic.github.io/django-o11y.
If you run into issues or have suggestions, open an issue in the django-o11y repository.