
The kubernetes-mixin is a popular resource for providing excellent dashboards and alerts for monitoring Kubernetes clusters. However, there’s still not much in place yet for autoscaling tools like PDBs, HPAs/VPAs, KEDA, Karpenter, or the Cluster Autoscaler. These essential components are commonly deployed in Kubernetes environments but don't have standardized, open source monitoring solutions. This blog post aims to solve that by introducing the kubernetes-autoscaling-mixin - a set of Prometheus rules and Grafana dashboards for Kubernetes autoscaling. This mixin includes coverage for Kubernetes core components such as HPA and PDB, as well as additional components like the KEDA, VPA, Karpenter, and the Cluster Autoscaler, ensuring you have visibility into the autoscaling mechanisms that keep your cluster running efficiently.
The mixin can be found on GitHub. The dashboards are the following:
- Kubernetes Autoscaling Horizontal Pod Autoscaler - A dashboard that provides an overview of the Horizontal Pod Autoscaler (HPA) in your Kubernetes cluster.
- Kubernetes Autoscaling Pod Disruption Budget - A dashboard that provides an overview of the Pod Disruption Budget (PDB) in your Kubernetes cluster.
- Kubernetes Autoscaling Vertical Pod Autoscaler - A dashboard that provides an overview of the Vertical Pod Autoscaler (VPA) in your Kubernetes cluster.
- Kubernetes Autoscaling Cluster Autoscaler - A dashboard that provides an overview of the Cluster Autoscaler in your Kubernetes cluster.
- Kubernetes Autoscaling Karpenter Overview - A dashboard that provides an overview of Karpenter (node pools, instance types, node counts etc.) in your Kubernetes cluster.
- Kubernetes Autoscaling Karpenter Activity - A dashboard that provides an overview of Karpenter's activity (scaling up and down) in your Kubernetes cluster.
- Kubernetes Autoscaling Karpenter Performance - A dashboard that provides an overview of Karpenter's performance in your Kubernetes cluster. Shows an overview of the interruption queue, work queue and the controller.
- Keda Scaled Objects - An overview of
ScaledObjects, including the total count and their status, with insights into scaling activity and errors. - Keda Scaled Job - An overview of
ScaledJobs, including the total count and their status, with insights into scaling activity and errors.
If consuming these through jsonnet then you can easily opt in and out of various components by modifying the config.libsonnet file. For example, if you only want to enable Karpenter and the Cluster Autoscaler, you can do so by setting the following configuration:
{
  _config+:: {
    karpenter+: {
      enabled: true,
    },
    clusterAutoscaler+: {
      enabled: true,
    },
    vpa+: {
      enabled: false,
    },
    keda+: {
      enabled: false,
    },
  },
}
The dashboards and alerts will be described in more detail in the upcoming sections. The prerequisites for non-core components in the mixin are also described.
Prerequisites
The core components as HPA and PDB have built-in metrics from kube-state-metrics, however, the additional components as VPA, Karpenter, and the Cluster Autoscaler require additional configuration. Here are the requirements for each component:
- Karpenter requires you to have a service monitor or a scrape configuration for the Karpenter metrics.
- For the Cluster Autoscaler, you need to have a service monitor or a scrape configuration for the Cluster Autoscaler metrics.
- The Vertical Pod Autoscaler requires you to configure
CustomResourceStateMetricsaccording to the VPA requirements in the repository README. I've also written a blog post on how to set up VPA recommendation metrics here. - Keda requires you to enable metric collection. This is typically done by deploying the Keda operator in your Kubernetes cluster. The operator automatically collects metrics from your scaled jobs and scaled objects. Using Helm, you should deploy Keda with the following values:
prometheus:
  metricServer:
    enabled: true
    serviceMonitor:
      enabled: true
  operator:
    enabled: true
    serviceMonitor:
      enabled: true
  webhooks:
    enabled: true
    serviceMonitor:
      enabled: true
Grafana Dashboards
Kubernetes Core
Horizontal Pod Autoscaler
The Grafana dashboard provides an overview of the Horizontal Pod Autoscalers in your Kubernetes cluster. It includes the following panels:
- Filters - Allows us to filter by namespace, HPA and metric name (e.g. memory or CPU).
- Summary - Provides an overview of the HPA. Also, there are time series graphs of the utilization and threshold, as well as the current, available, minimum and maximum replicas. Time series graphs display utilization versus threshold, as well as replica counts (current, available, minimum, and maximum)."

Pod Disruption Budget
The Grafana dashboard provides an overview of the Pod Disruption Budgets in your Kubernetes cluster. It includes the following panels:

- Filters - Allows us to filter by namespace and PDB.
- Namespace summary - Provides an overview of Pod Disruption Budgets (PDBs) in the selected namespace, showing allowed disruptions along with the current, expected, and desired pod counts for each PDB.
- PDB summary - Displays an overview of the selected Pod Disruption Budget (PDB), including allowed disruptions and current, expected, and desired pod counts. Also provides a historical time series graph for disruptions allowed and pod counts (current, expected, and desired).
Karpenter
Karpenter Overview
The Grafana dashboard provides an overview of Karpenter in your Kubernetes cluster. It includes the following panels:
- Filters - Allows us to filter by namespace and Karpenter controller. The filters also allow us to break down the node pools by region, zone, architecture, OS, instance type and capacity type.
- Node pool summary - Provides an overview of the node pools. The node pool count and the usage and limits of the node pools. It also provides a summary of the node pools by region, zone, architecture, OS, instance type and capacity type.
- Pod summary - Provides an overview of pod usage and limits, along with a summary by node pool, instance type, and capacity type.
- Node pools - Displays a table of the node pools and their characteristics.
- Nodes - Displays a table of the nodes and their characteristics.


Karpenter Activity
The Grafana dashboard offers an overview of node pool status (disruptions and scaling) and pod activity (phases and startup times) in your Kubernetes cluster. It includes the following panels:
- Node pool activity - Provides the activity of the node pools - the amount of disruptions and scaling events and the reasoning behind them.
- Pod activity - Displays pod activity, including time series for pod phases and startup durations.

Karpenter Performance
The Grafana dashboard provides an overview of the Karpenter's performance in your Kubernetes cluster. It includes the following panels:
- Summary - Summarizes Karpenter performance, displaying cluster sync status, total node count, cloud provider errors, node termination duration, and pod startup duration.
- Interruption queue - Provides insights to the interruption queue. It shows the received messages, the deleted messages and the interruption duration.
- Work queue - Visualizes work queue depth along with queuing and processing durations.
- Controller - Summarizes the controller's reconciliation requests per second, categorized by request type.


Cluster Autoscaler
The Grafana dashboard provides an overview of the Cluster Autoscaler in your Kubernetes cluster. It includes the following panels:
- Summary - Summarizes Cluster Autoscaler metrics, including total and maximum node counts, node group count, and unschedulable pod count. Time series visualizations show unschedulable pods, node activity (ready, unready, unregistered), and autoscaling events (unneeded nodes, total nodes, and scaled-up nodes).

Vertical Pod Autoscaler
The Grafana dashboard provides an overview of the VPA recommendations for both memory and CPU. It includes the following panels:
- Namespace Summary - Provides an overview of the VPA recommendations per namespace. See the memory and CPU target and lower and upper bounds for each VPA in the selected namespace.
- VPA Summary - Provides a history of recommendations for the selected VPA. See the historical memory and CPU target and lower and upper bounds for each container in the selected VPA. Also, it provides a summary for what resource configuration would be required for guaranteed and burstable QoS classes.


KEDA
Scaled Objects
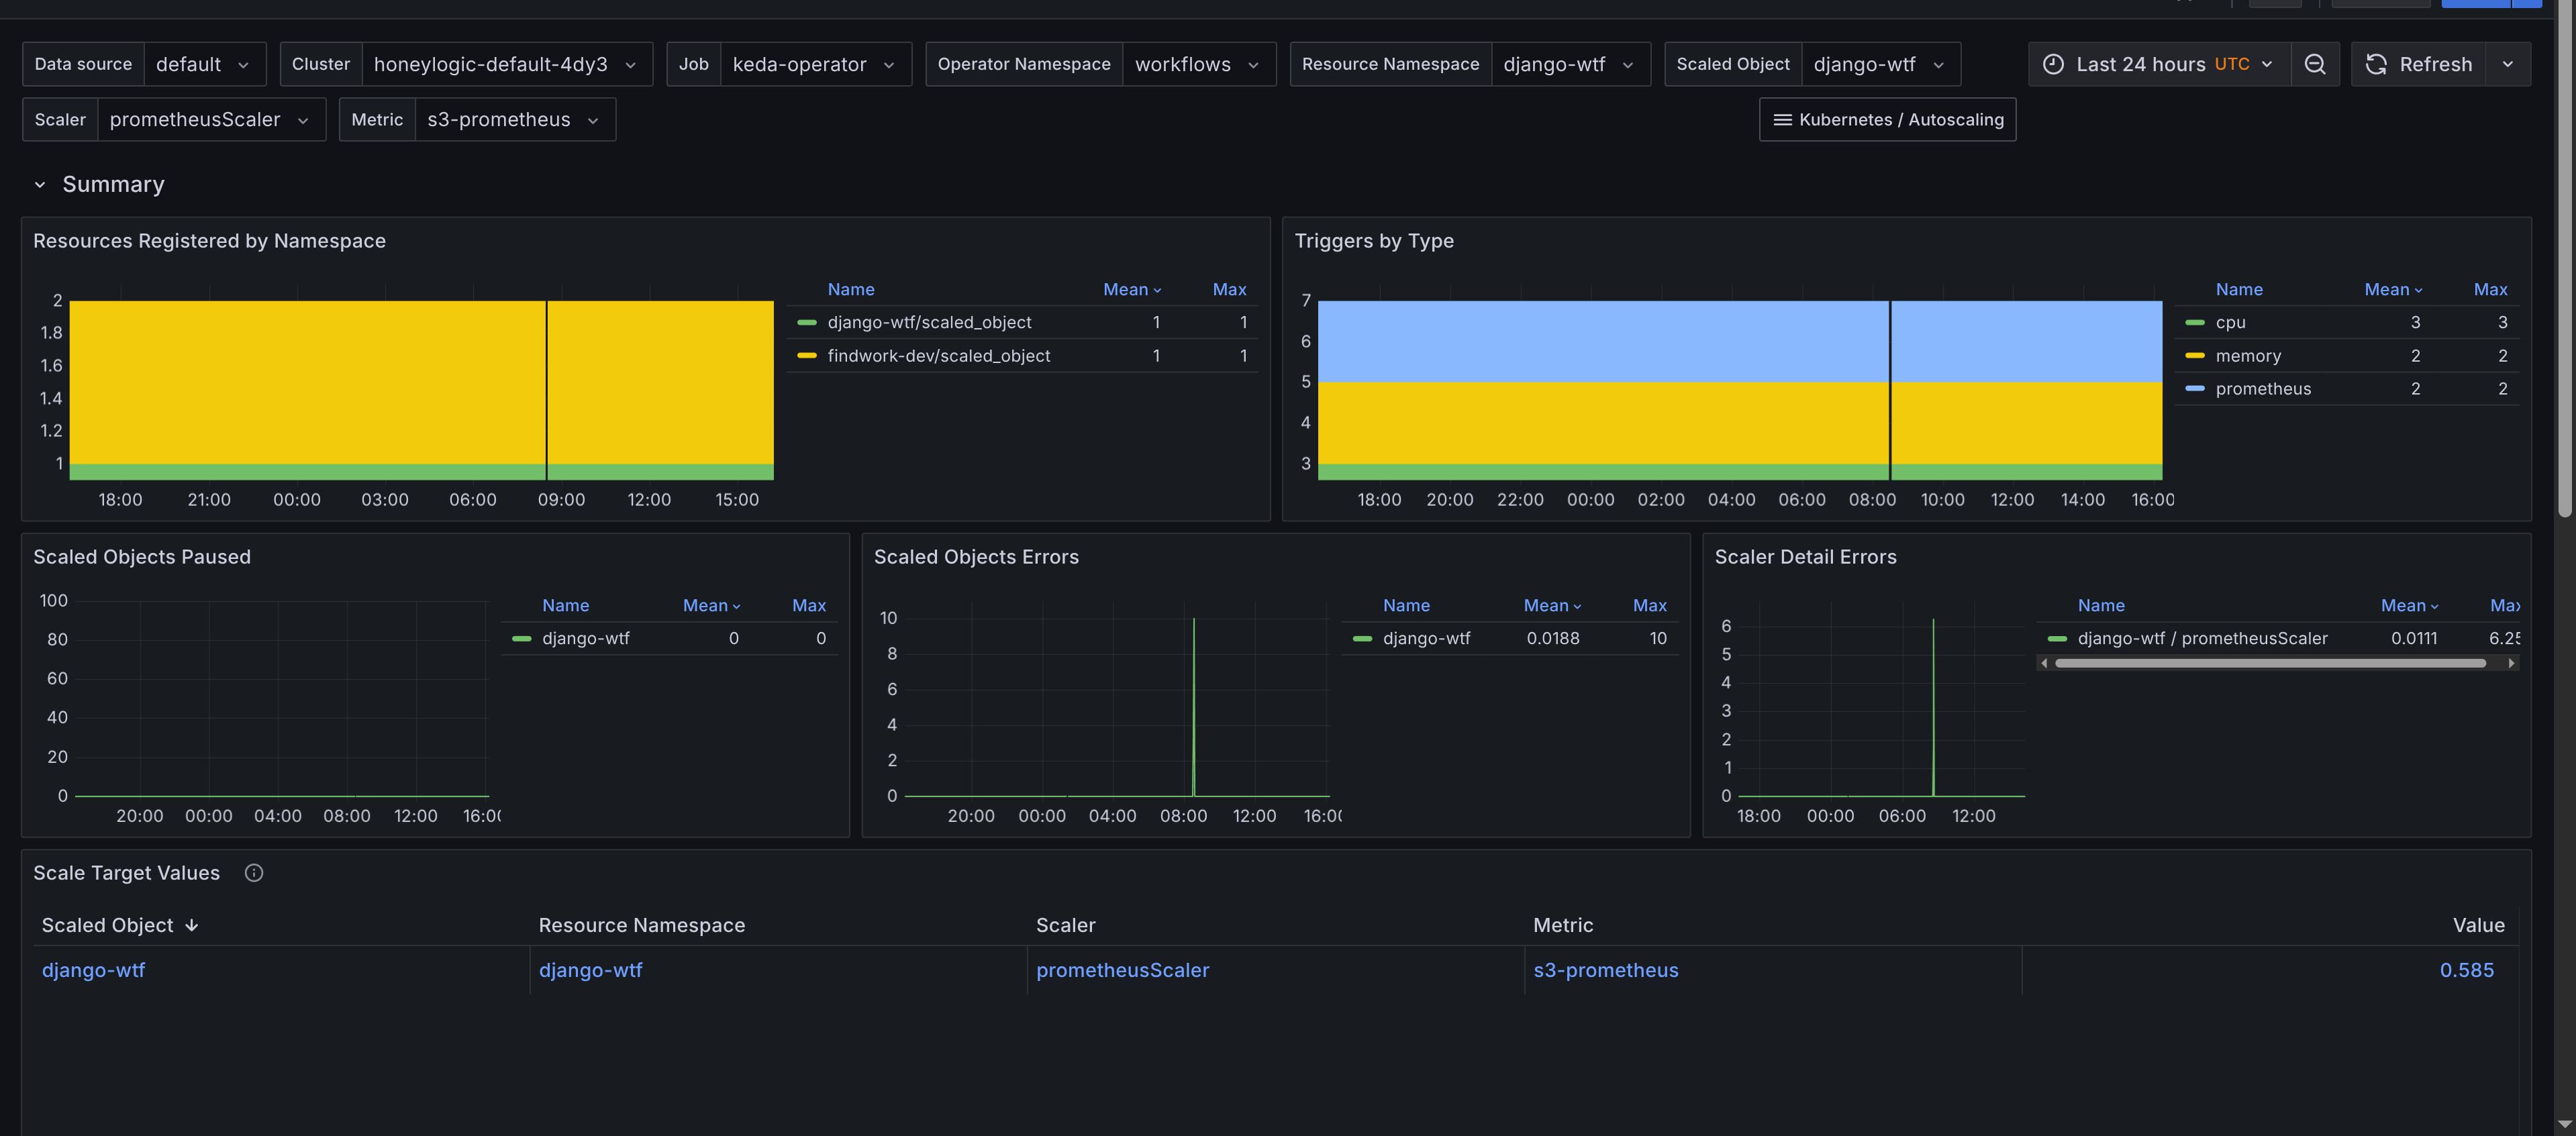
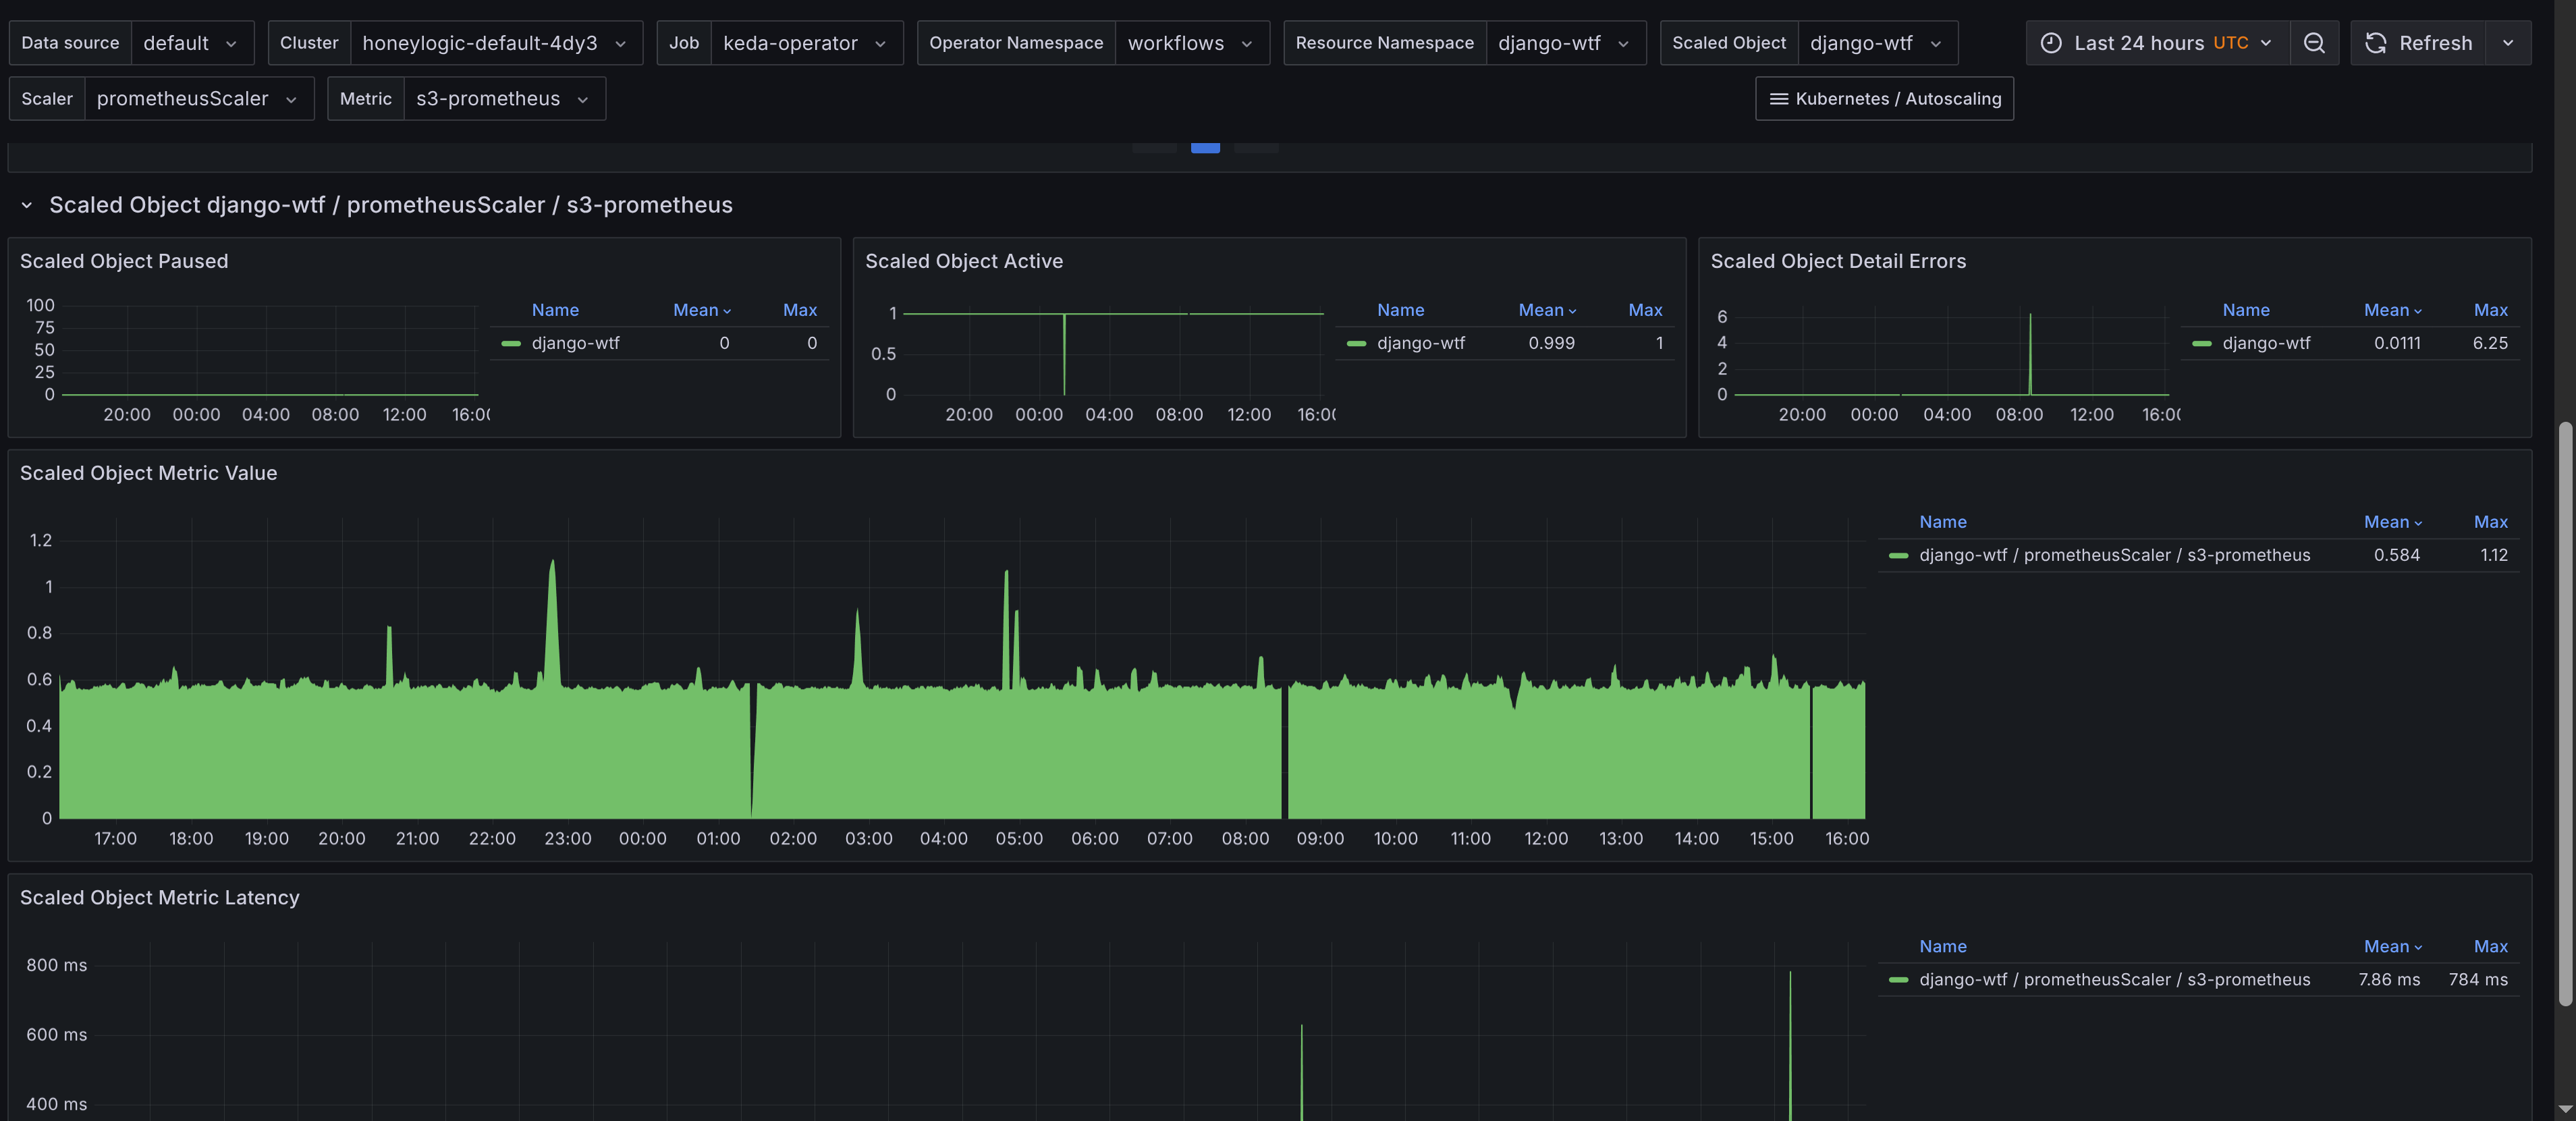
The Grafana dashboard for Scaled Objects provides insights into KEDA's scaled objects. Its panels include:
- Summary - Provides an overview of
ScaledObjects, including the total count and their status. Provides a table of scaled objects, their namespaces, and their types with links to the Horizontal Pod Autoscalers (HPAs) dashboard for further scaling insights. This allows you to quickly navigate to the HPA dashboard for more detailed scaling information. The requirement is to add Horizontal Pod Autoscaler dashboard to your Grafana instance, which is available in the kubernetes-autoscaling-mixin and on Grafana's dashboard page. ScaledObjectby object, scaler and metric - Displays scaled objects grouped by their associated scaler and metric, providing a clear view of how each scaled object is configured. Gives insights to latency of metric collection for scaled objects, which can impact scaling decisions and also the value of the metric used for scaling.
Scaled Jobs
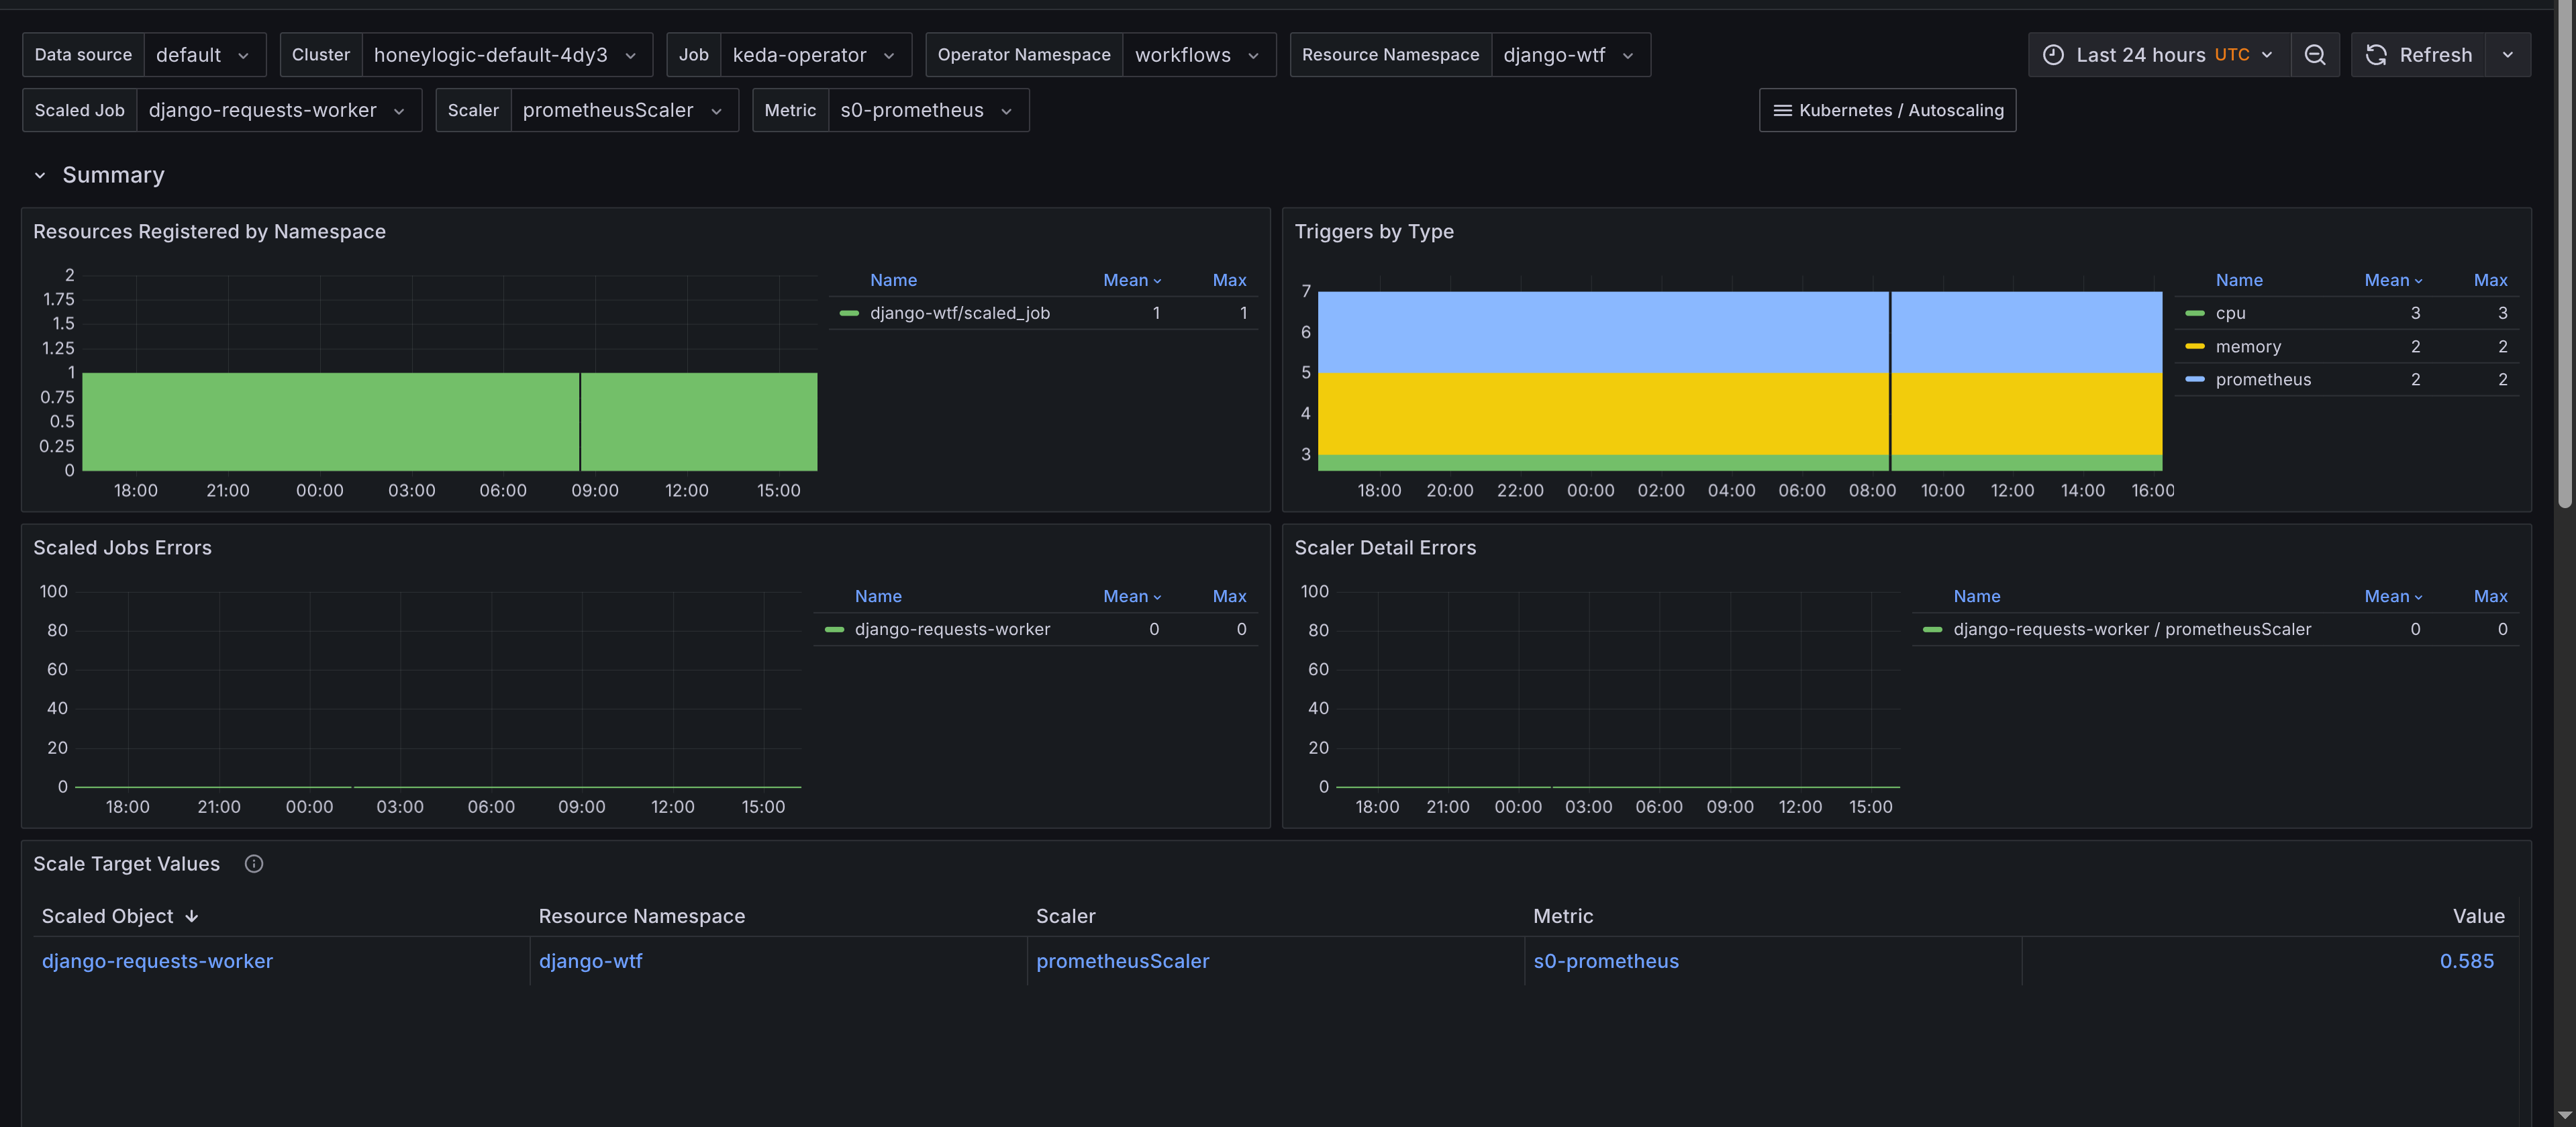
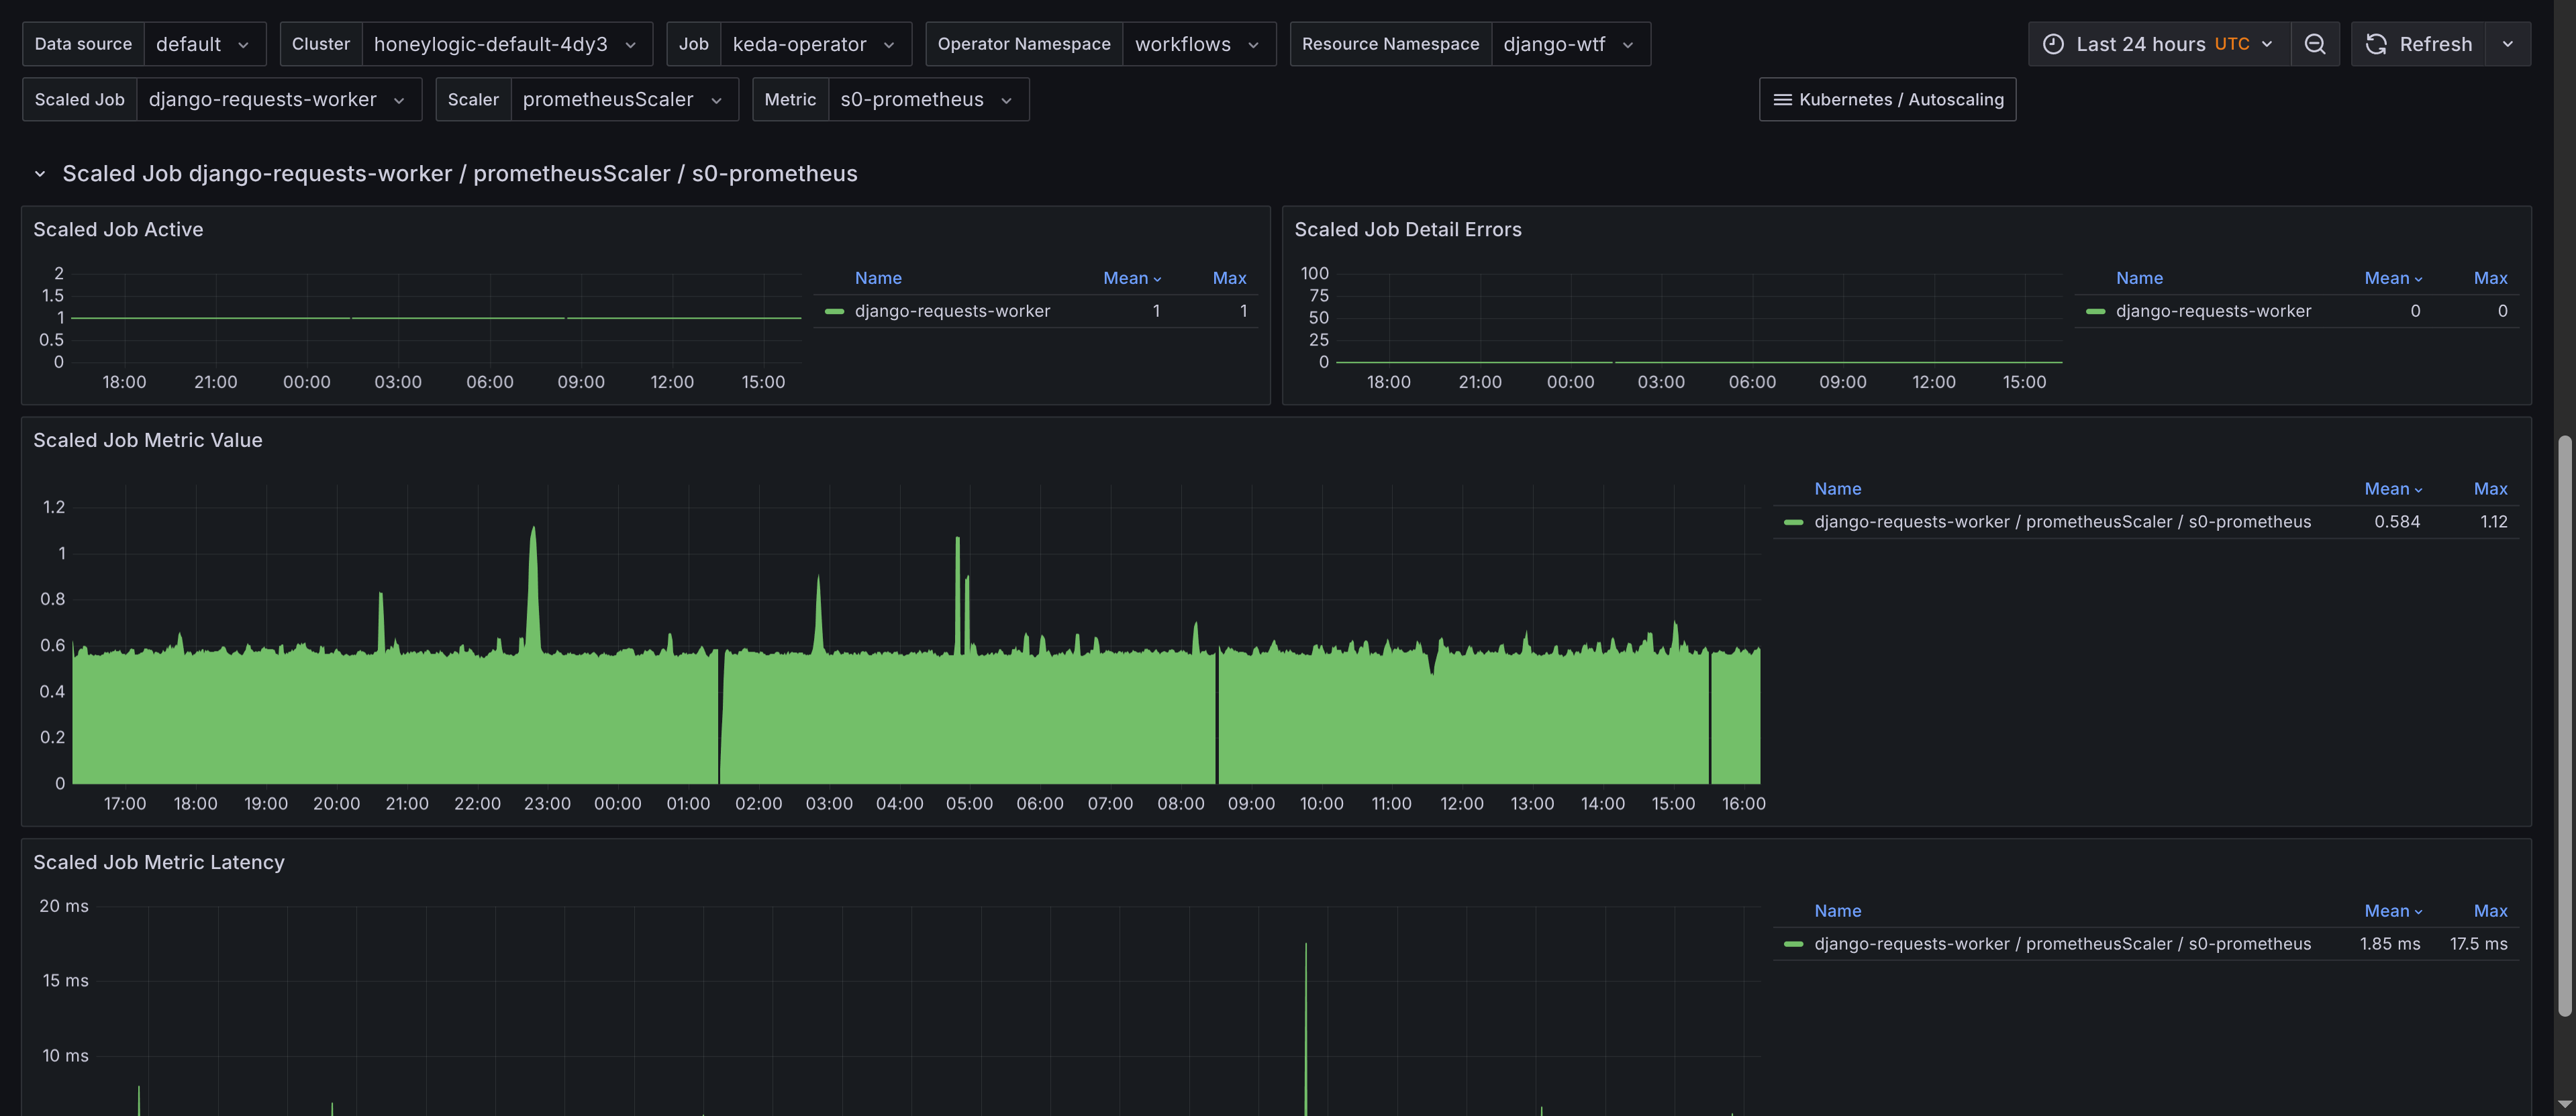
The dashboard for Scaled Jobs is similar but tailored towards KEDA-scaled jobs. Monitoring panels include:
- Summary - Provides an overview of
ScaledJobs, including the total count and their status. Has a table of scaled jobs, their namespaces, and their types with links to theKubernetes Workloaddashboard for job insights. This allows you to quickly navigate to the workload dashboard for more scaling insights, showing when jobs are added and resource consumption. The requirement is to add Kubernetes Workload dashboard to your Grafana instance, which is available in the kubernetes-mixin and also to adjust the URL so it's predictable. Thejsonnetlibrary would need the following configuration to be added to theconfig.libsonnetfile:
Alerts
Alerts are trickier to get right for a generic use case, however they are still provided by the kubernetes-autoscaling-mixin. You can configure alerts using the config.libsonnet file in the repository. If you're familiar with Jsonnet, customizing these alerts is straightforward. The alerts can be found on GitHub, and I'll add a description for the alerts below.
Note: These alerts are a work in progress. Please open issues for any suggestions or improvements.
Karpenter Alerts
- Alert name:
KarpenterCloudProviderErrors
Alerts when Karpenter has had cloud provider errors in the last 5 minutes.
- Alert name:
KarpenterNodeClaimsInstanceTerminationDurationHigh
Alerts when the instance termination duration for a node claim is high in the last 5 minutes. This indicates that the node claim is taking too long to terminate instances.
- Alert name:
KarpenterNodepoolNearCapacity
Alerts when a Karpenter node pool is near capacity in the last 15 minutes. The current threshold is 75% of the limit. This indicates that the node pool limits need to be scaled.
Cluster Autoscaler Alerts
- Alert name:
ClusterAutoscalerNodeCountNearCapacity
Triggers an alert when the Cluster Autoscaler node count reaches 75% of maximum capacity over the last 15 minutes. This indicates that the node group may need scaling to increase the maximum node limit.
- Alert name:
ClusterAutoscalerUnschedulablePods
Alerts when the Cluster Autoscaler detects unschedulable pods within the last 15 minutes. This typically indicates that node groups with their taints or label selectors do not match the pod requirements, or that there are insufficient resources available in the cluster.
KEDA Alerts
- Alert name:
KedaScaledJobErrors
Alerts when KEDA scaled jobs encounter errors.
- Alert name:
KedaScaledObjectErrors
Alerts when KEDA scaled objects encounter errors.
- Alert name:
KedaScalerLatencyHigh
Alerts when the latency of KEDA scaled object metrics is high. This indicates that the time taken to collect metrics for scaled objects has increased significantly, potentially impacting scaling decisions. The default threshold is set to 5 seconds, but you can adjust it based on your requirements.
- Alert name:
KedaScaledObjectPaused
Alerts when a scaled object is paused. This indicates that the scaled object isn't processing scaling triggers, which could lead to performance issues or resource underutilization. The default threshold is set to 24 h as the pause can be intentional, but you can adjust it based on your requirements.
- Alert name:
KedaScalerDetailErrors
Alerts when KEDA scaler detail errors occur. This indicates that there are issues with some parts of the scaler, which could lead to incorrect scaling decisions. It might be that you can't fetch Prometheus metrics or that the scaler is not configured correctly.
Conclusion
The kubernetes-mixin is great but lacks support for autoscaling components such as HPA, PDB, VPA, Karpenter and the Cluster Autoscaler. The kubernetes-autoscaling-mixin aims to solve that by providing dashboards and alerts for these components. While this mixin provides a solid foundation, it's only the first iteration, and there is plenty of room for improvement. Therefore, I would love to get feedback and suggestions on how to improve the kubernetes-autoscaling-mixin. Please open issues in the repository if you have any suggestions or improvements. The goal is to eventually standardize Kubernetes autoscaling dashboards and alerts. Looking forward to collaborating!