
ArgoCD has by default support for notifying when an Application does not have the desired status through triggers. For example, when an application becomes OutOfSync or Unhealthy, a notification is sent to your configured notification service (e.g. Slack). This was my initial setup, but I found it to be flaky, where networking issues between the server and controller for a couple of seconds would send many Slack messages that the Application status is unknown. An application becoming unhealthy would instantly send alerts to Slack. To resolve this I wanted interval based alerts and as usual Prometheus was the solution to this. ArgoCD provides Prometheus metrics out of the box, and alongside the metrics there's a Grafana dashboard for ArgoCD. The dashboard is good, but the project is lacking any open source alerting. Even more so, it does not have a monitoring mixin for providing dashboards and alerts to be consumed easily.
I've created a monitoring mixin for ArgoCD which will provide Prometheus alerts and Grafana dashboards focusing on ArgoCD operational status, ArgoCD Applications and ArgoCD notifications.
You can find the source code to the alerts and dashboard in github/argo-cd-mixin.
There are three dashboards available:
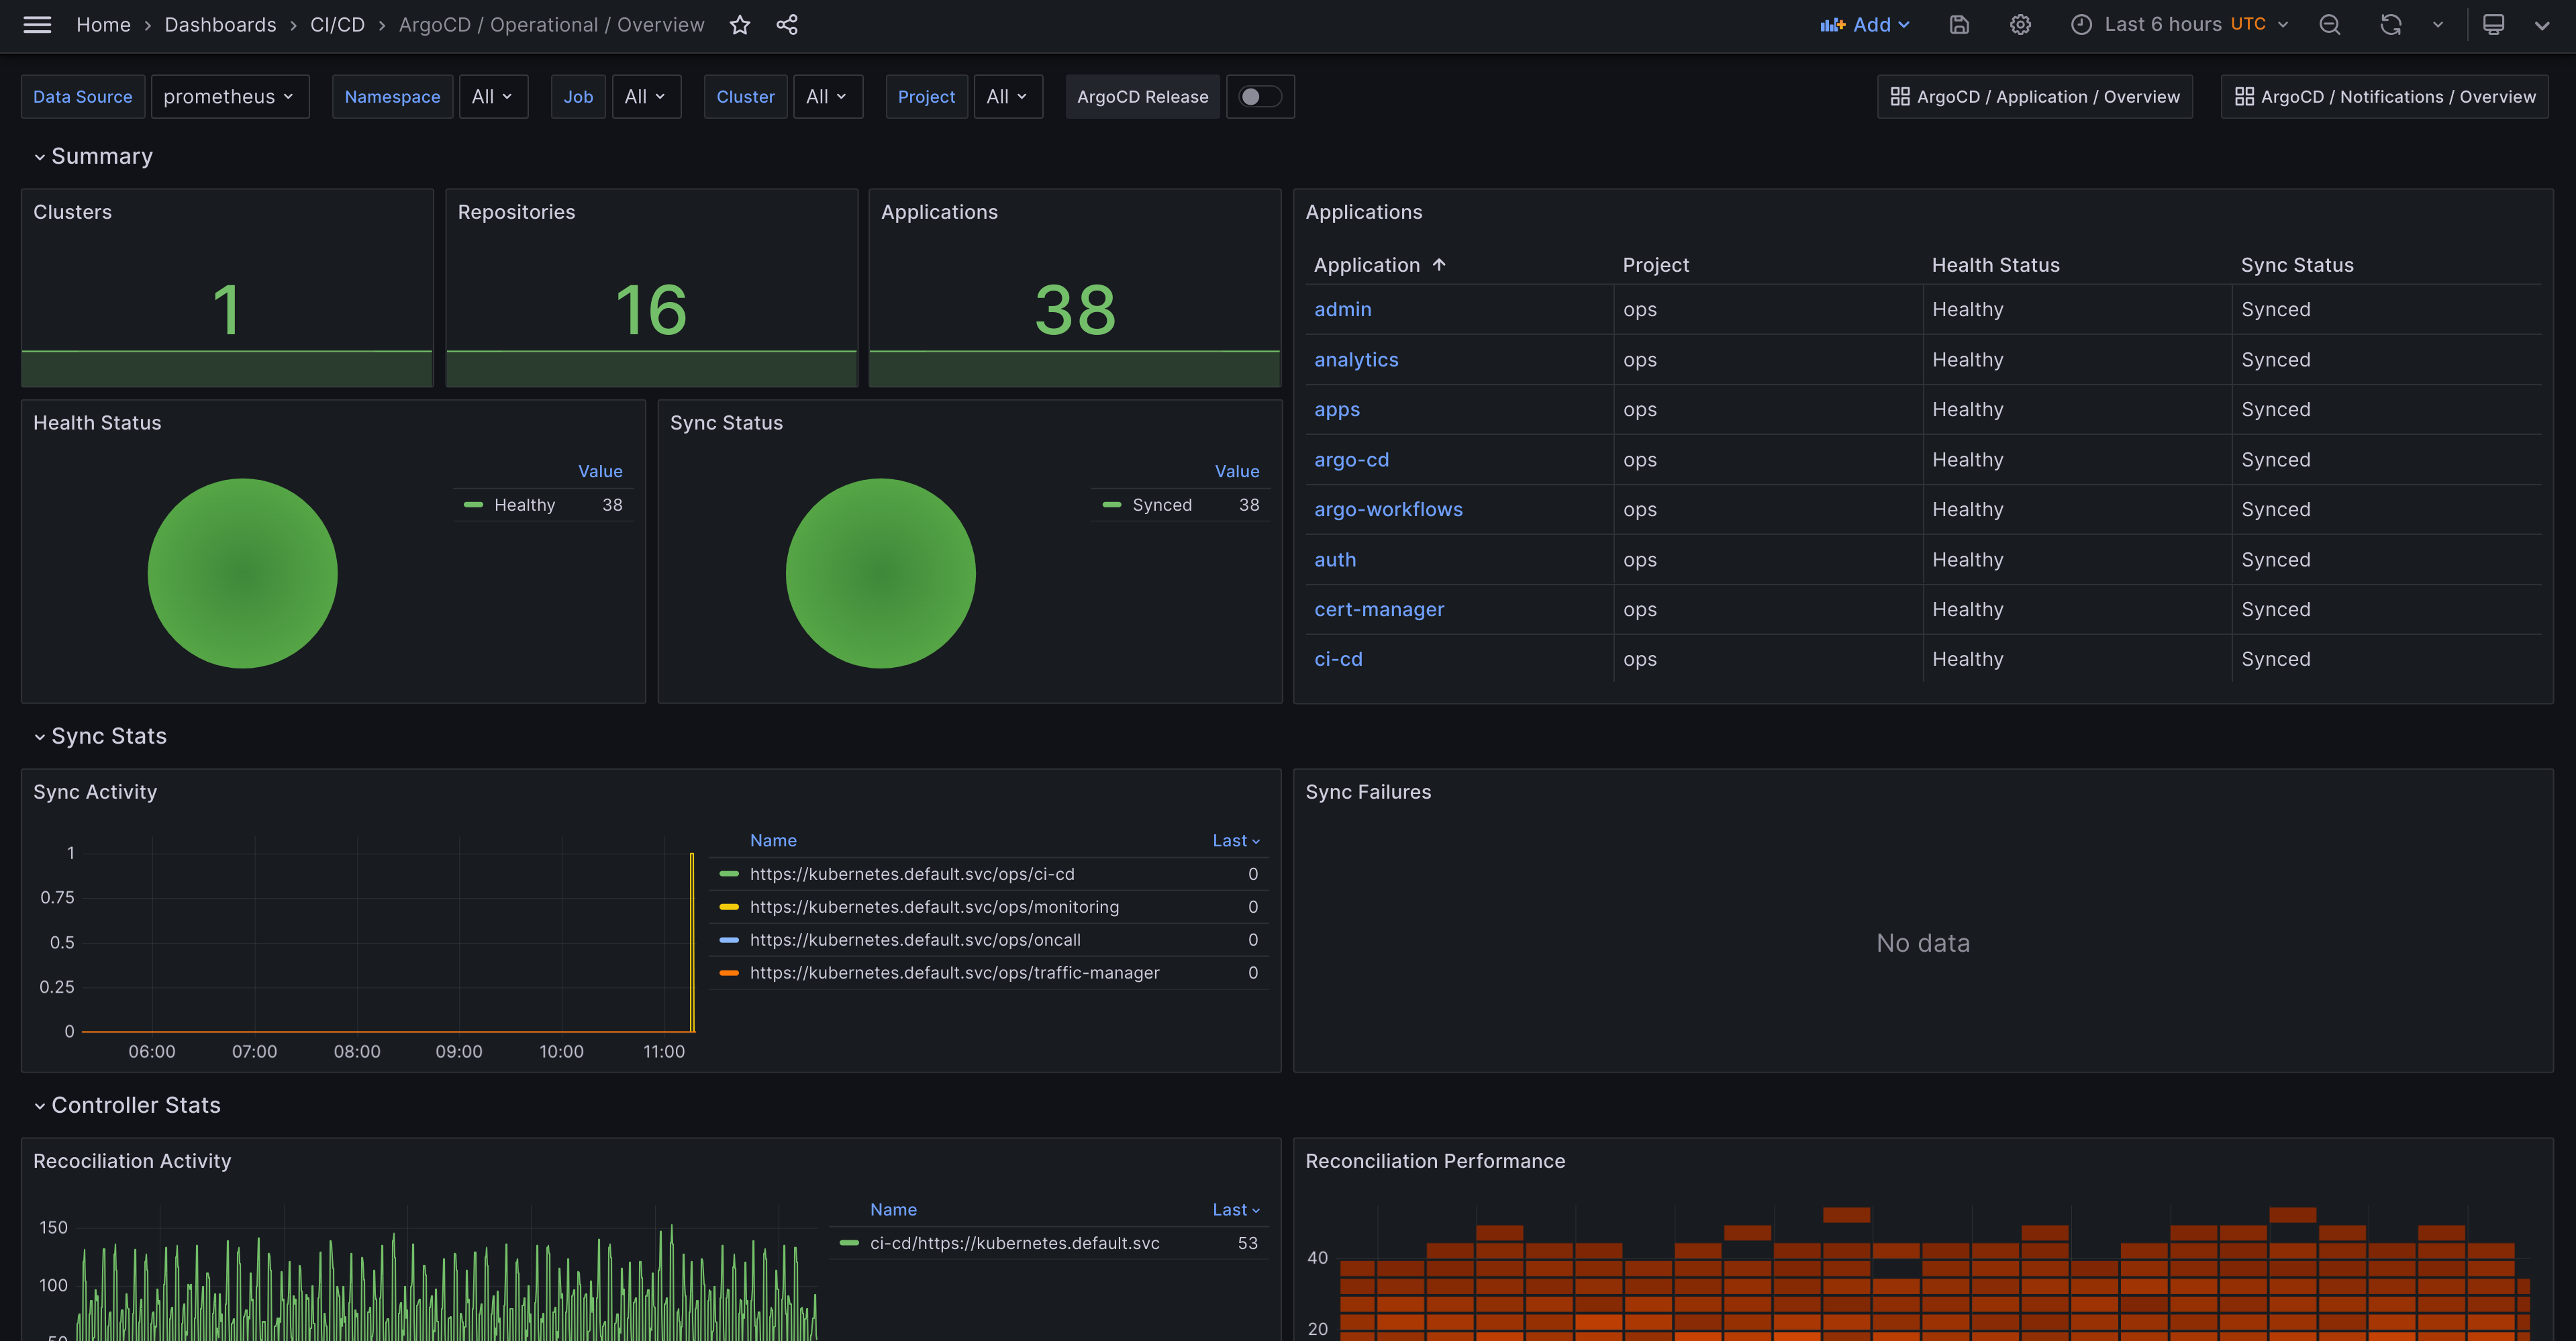
- ArgoCD Operational Overview - An overview of ArgoCD's operational statuses. Git requests, cluster objects, Kubernetes API calls etc.
- ArgoCD Application Overview - An overview of
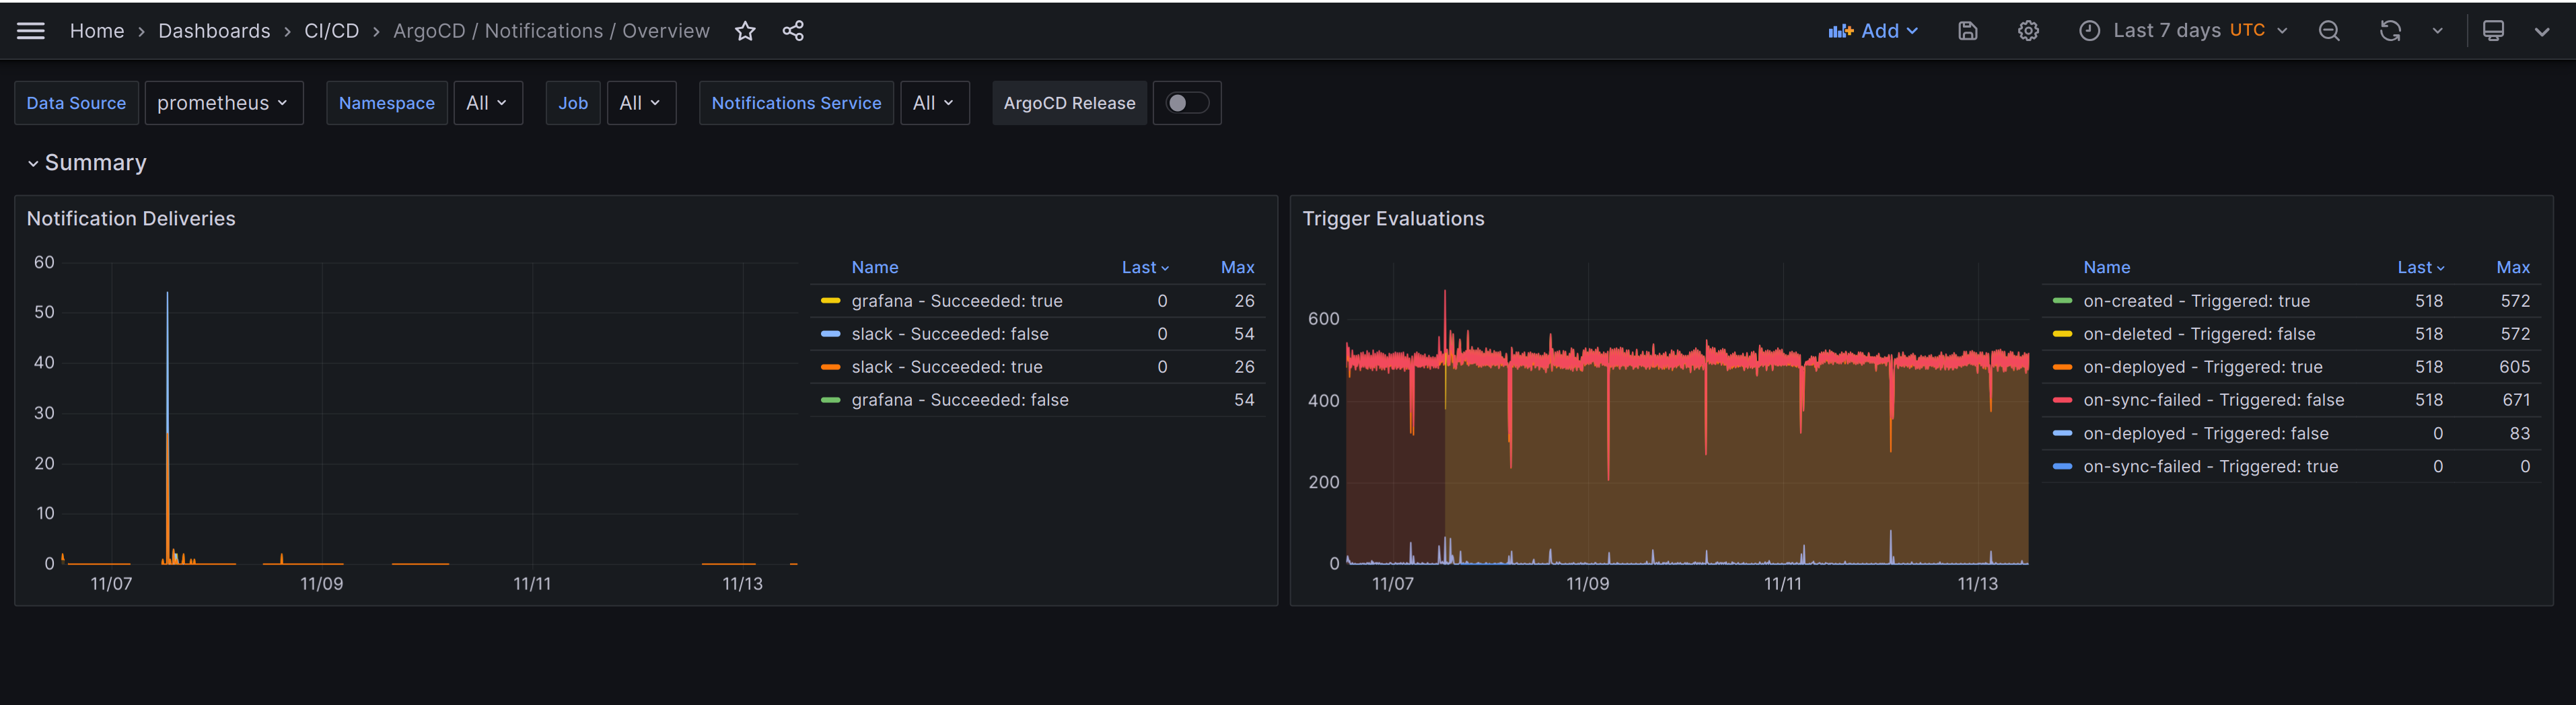
Applicationstatuses. - ArgoCD Notifications Overview - An overview of the notification controller. Notifications that failed per notification service (Slack, Grafana etc.).
There are also Prometheus alerts stored in GitHub that you can import that alert on various Application statuses and notification failures.
The dashboards and alerts are work in progress, and feel free to share feedback in the argo-cd-mixin repository of what you would like to see or any issues you experience.
If you want to go directly to the dashboards you can use the links above, the rest of the blog post will describe the various alerts and dashboards.
Grafana Dashboards
There are 3 dashboards, and they are split as otherwise there would be many graphs in one dashboard, filters would be applicable for a portion of the panels as not all metrics contain the filtered labels making it unclear when they apply and some expensive metrics would put high pressure on your Prometheus backend.
The upcoming sections will describe each dashboard.
ArgoCD Operational Status Dashboard
The ArgoCD operational overview dashboard focuses on providing an overview of your ArgoCD operational status. The following things are core for the dashboard:
- Summary - Provides a section that summarizes clusters, applications and repositories. It displays out of a summary sync and unhealthy application, and also it displays all applications individually.
- Sync Stats - Provides a section that displays reconciliation activity and performance, Kubernetes API activity and Kubectl runs.
- Cluster Stats - Provides a section that displays the count of Kubernetes resource objects, ArgoCD resource objects and cluster events.
- Repo Server Stats - Provides a section that displays the repo server service status, showing Git requests and performance.
ArgoCD Application Overview Dashboard
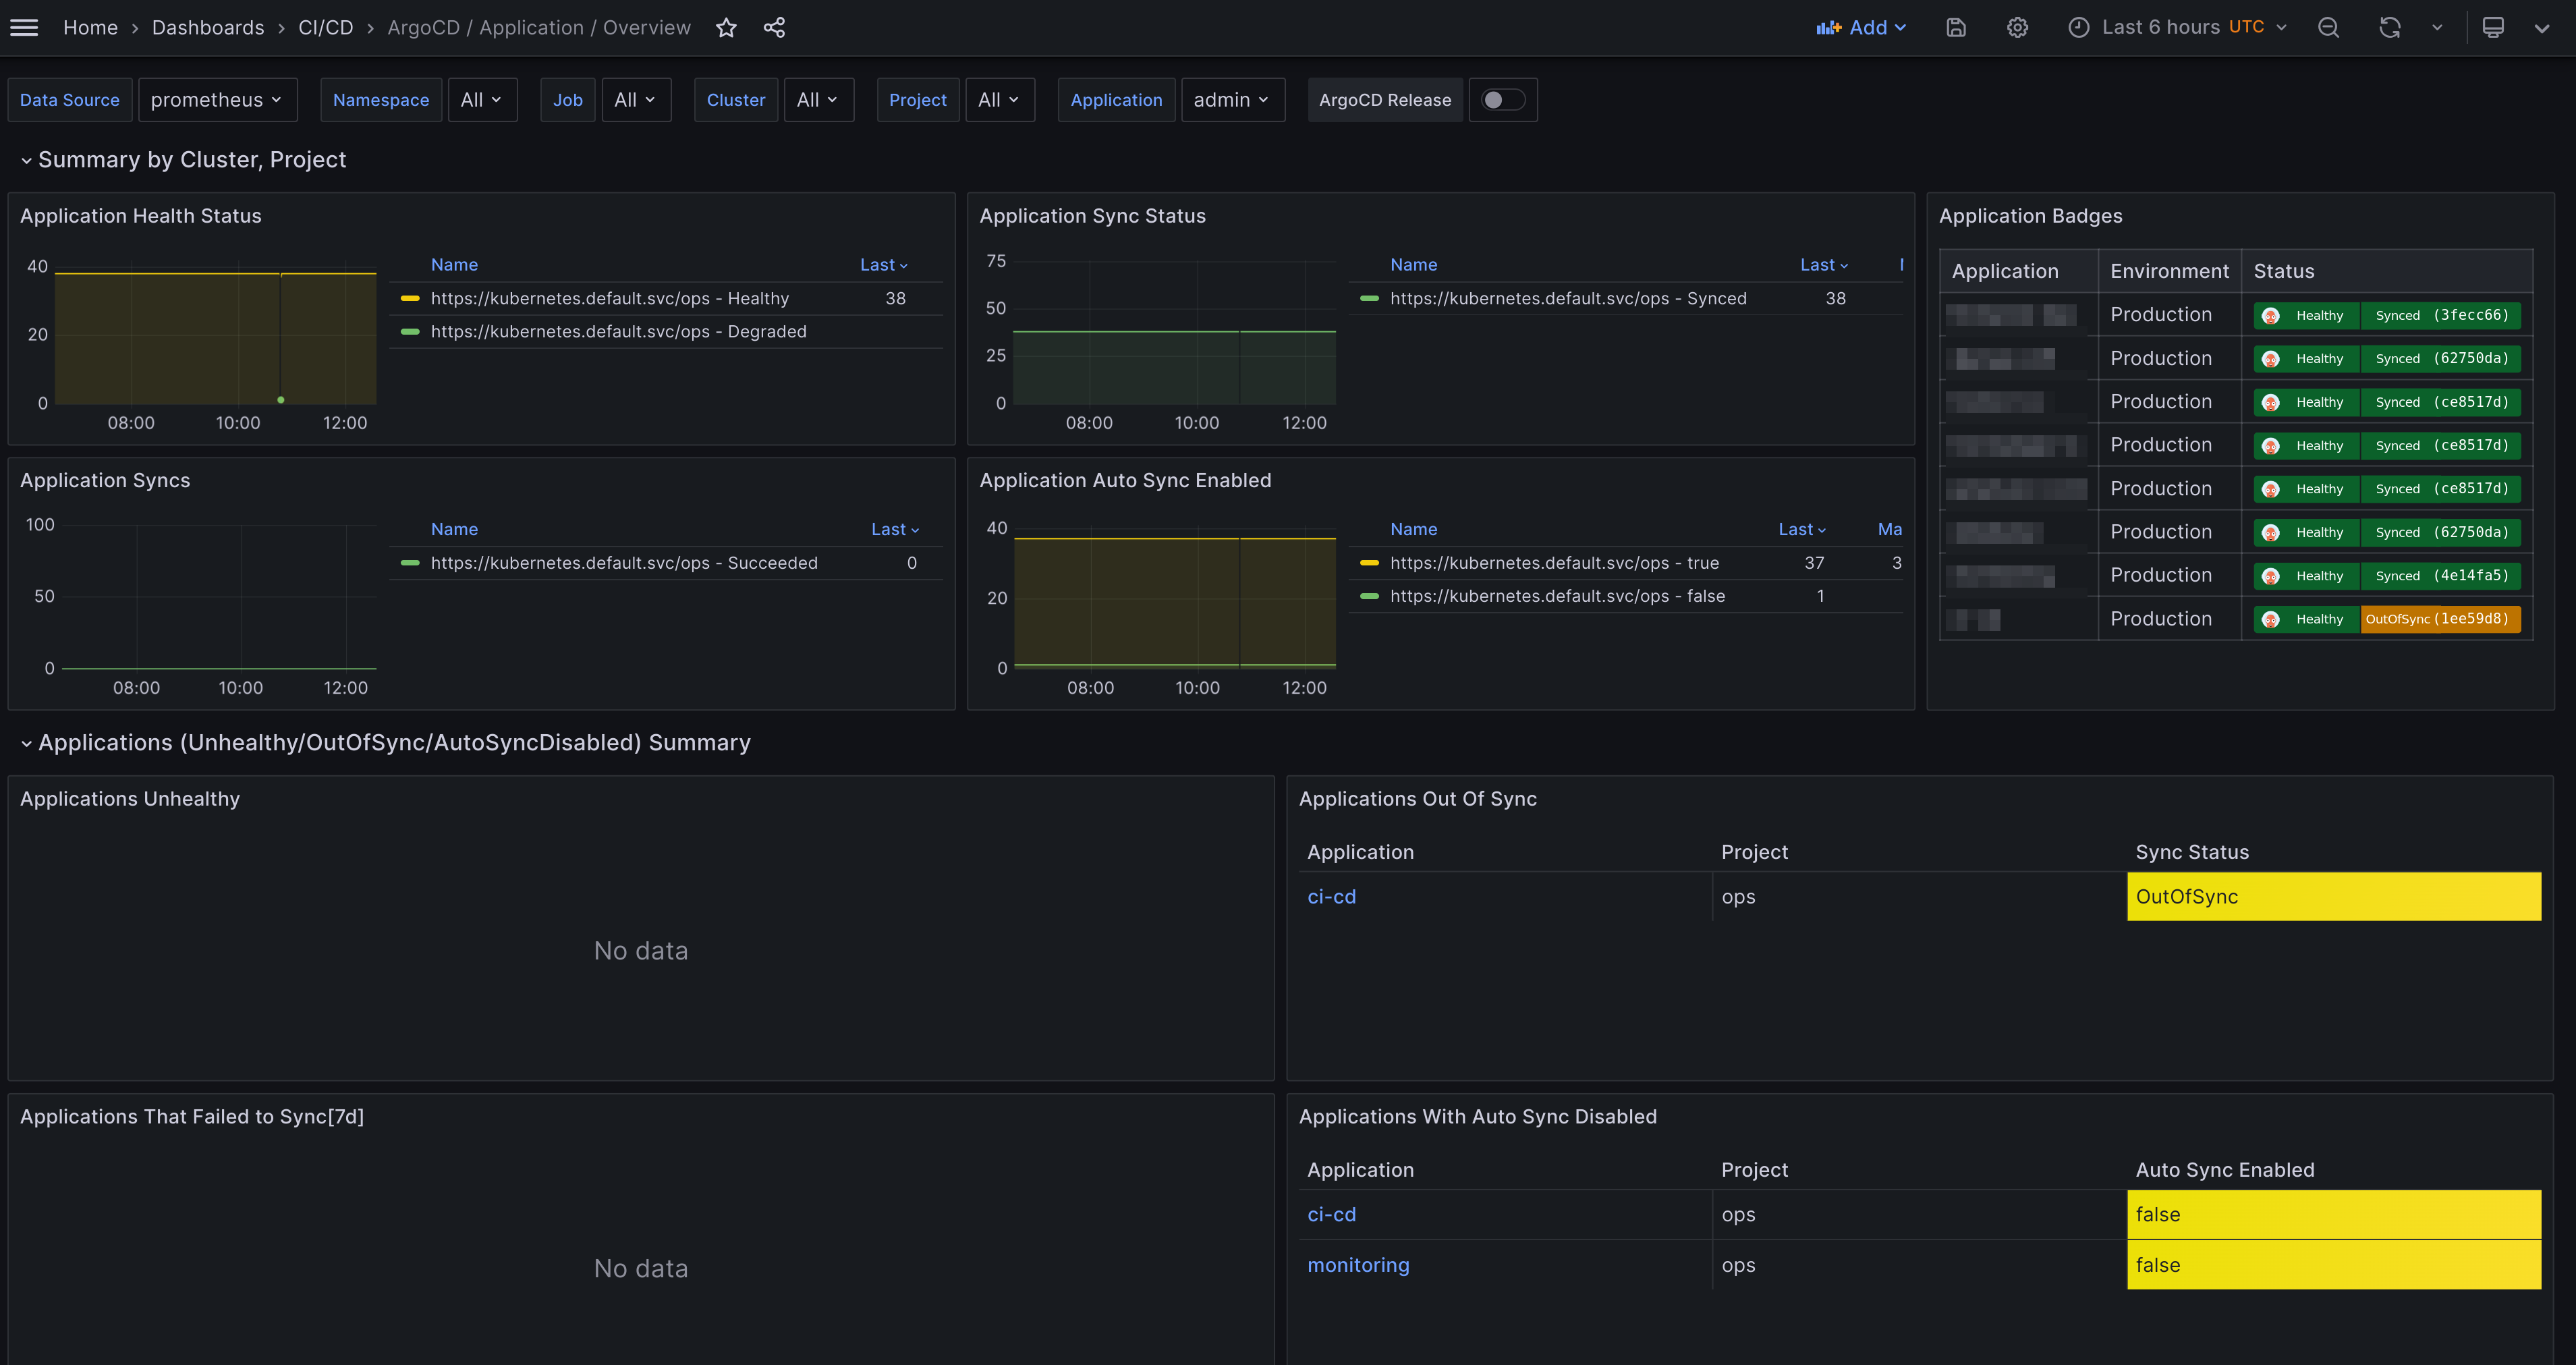
The ArgoCD Application overview dashboard focuses on providing an overview of your ArgoCD applications. The following things are core for the dashboard:
- Summary - Provides a section that summarizes
Applicationsby cluster and project. It displays out of sync, unhealthy applications and also displays applications that have auto sync disabled. Also, if configured, the dashboard will show ArgoCD application badges. This requires status badges to be enabled and also to configure the variable calledapplicationsin the mixin. For example, you can add the following to theconfig.libsonnet.
applications: [
    ...
    {
      name: 'test-app',
      environment: 'Production',
    },
    {
      name: 'hodovi-cc',
      applicationName: 'apps',
      environment: 'Production',
    },
    ...
- Applications (
Unhealthy/OutOfSync/AutoSyncDisabled) Summary - Provides a section that shows 4 tables showing the common ArgoCD non-healthy application states. - Application - A section showing the health of a specific application(s). Uses the filter called
applicationand is useful for showing the selected application's status over time.
ArgoCD Notifications Overview
The ArgoCD notifications overview dashboard focuses on providing an overview of your ArgoCD notifications. It's straightforward and focuses on the following two:
- Notifications - Shows notifications counts by service and status.
- Trigger evaluations - Shows trigger evaluation counts by trigger type(on-created, on-deleted, on-sync-failed etc.).
Prometheus Alerts
Alerts are tricky to get right for a generic use case, however, they are still provided by the argo-cd-mixin. They are also configurable with the config.libsonnet package in the repository, if you are familiar with Jsonnet then customizing the alerts should be fairly straight forward. The alerts can be found on GitHub, and I'll add a description for the alerts below.
Adjust any of the alerts and add any new ones that you require. Open issues and share feedback in the GitHub repository!
Application Alerts
- Alert name:
ArgoCdAppOutOfSync
Alerts when an ArgoCD Application is out of sync for longer than 15 minutes.
- Alert name:
ArgoCdAppUnhealthy
Alerts when an ArgoCD Application does not have the status Healthy|Progressing for longer than 15 minutes.
- Alert name:
ArgoCdAppAutoSyncDisabled
Alerts when an ArgoCD Application does not have auto sync enabled for longer than 2 hours. By default, the expectation is a GitOps approach where everything syncs automatically from Git without any manual interaction. You can add exempt applications by modifying the variable argoAutoSyncDisabledIgnoredAppswith the value, for example "ci|other-manual-sync|monitoring" which denotes three different applications using regex. The threshold of 2 hours is high enough to leave space for any urgent fixes needed by manually interfering with the GitOps cycle (rollback, pause, manually apply manifests etc.).
- Alert name:
ArgoCdAppSyncFailed
Alerts when an ArgoCD Application failed to sync in the past 10 minutes.
Notification Alerts
- Alert name:
ArgoCdNotificationDeliveryFailed
Alerts when an ArgoCD notification failed, can indicate of incorrectly configured notification services.
Summary
The default dashboard provided by ArgoCD works great overall, however I find it easier to use dashboards specific to one goal e.g Application status and perform a deep dive on just applications. Also, pairing alerts and dashboards and adding dashboard links to the alerts makes much more sense when the dashboard is not generic that covers ArgoCD fully as the default dashboard does. The built-in ArgoCD triggers work fine for a start, but the statuses can change over time in short iterations, as for example application health status. This makes the triggers noisy and flappy. Time series and interval alerting makes much more sense, and that's why I've migrated alerting to Prometheus.